

Cross-project reporting is defined as the process of aggregating and analysing data from multiple projects into a single, unified view to support oversight, coordination, and performance measurement. Project managers and business analysts working across portfolios or programmes rely on this practice to spot patterns, track shared resources, and make decisions that no single project report can support alone. The Project Management Institute (PMI) recognises portfolio-level visibility as a core governance requirement, and cross-project reporting is the mechanism that delivers it. Platforms like Pocketpmo are built specifically to address this need, providing consolidated dashboards and AI-driven insights across complex multi-project environments.
What is cross-project reporting and what data does it include?
Cross-project reporting consolidates status updates, milestones, resource allocation, risk registers, and financial data from multiple projects into one coherent view. The data sources are rarely uniform. Teams pull information from different project management tools, spreadsheets, and departmental systems, each with its own structure and terminology.
The core data types typically included are:
- Status and progress: RAG ratings, percentage completion, and milestone achievement across all active projects.
- Resource allocation: Who is assigned where, at what capacity, and whether any team members are over-committed.
- Risks and issues: Consolidated RAID logs that surface cross-cutting threats before they escalate.
- Financials: Budget versus actuals, forecast spend, and variance analysis at portfolio level.
- Milestones and dependencies: Key dates and inter-project dependencies that affect delivery sequencing.
Aggregation techniques include shared filters, cross-project queries, and consolidated dashboards. APIs and integrations play a central role in enabling unified project views without requiring manual exports. The challenge is that each data source uses its own field definitions, which creates inconsistencies the moment you try to combine them.
Pro Tip: Before building any cross-project report, map every data field from each source system. Identify where the same concept, such as "priority" or "status," uses different values across projects. Resolving this mapping upfront saves hours of correction later.

What are the common challenges in cross-project reporting?
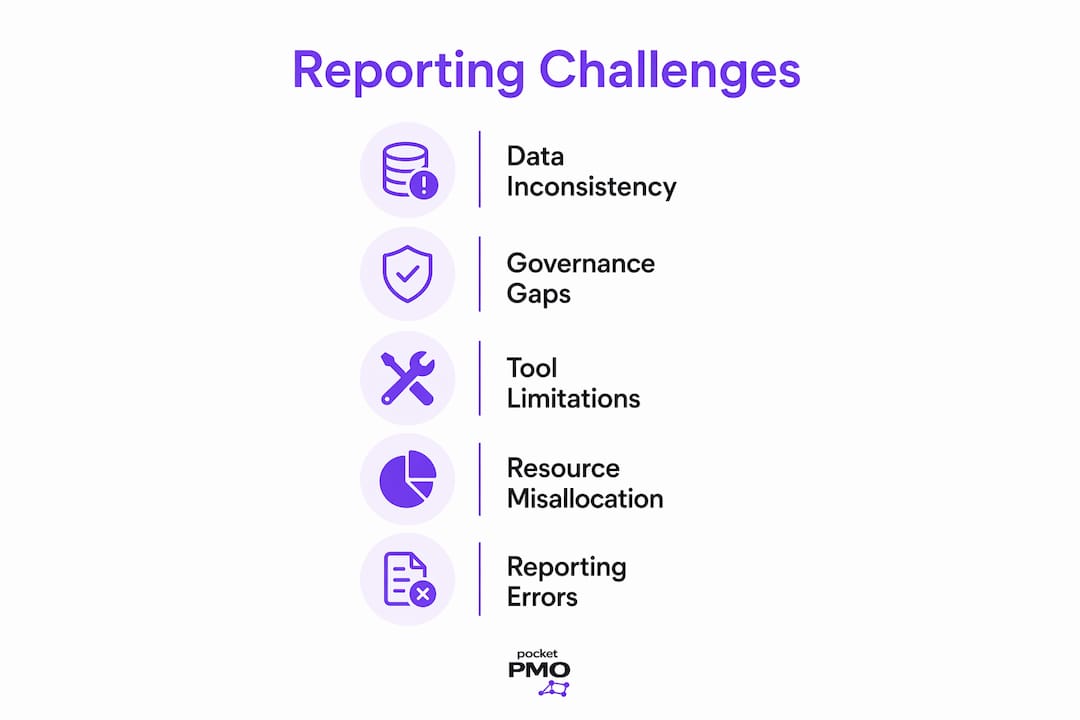
Inconsistent project configurations are the leading cause of inaccurate reports, often omitting up to two thirds of relevant data due to varied field usage across teams. That figure is striking. It means a report can look complete and confident while missing the majority of the data it should contain.
The most common inconsistencies project managers encounter are:
- Label and component naming: One team logs bugs under "Backend," another uses "back-end" or "BE." Filters that match one label miss the others entirely.
- Priority definitions: "High" in one project means a same-day fix. In another, it means this quarter. Aggregated priority reports become meaningless without a shared definition.
- Date field usage: Some teams populate due dates; others leave them blank and track deadlines in comments. Date-based filters then exclude valid work items.
- Status terminology: "In Review," "Under Review," and "Awaiting Approval" may describe the same state across three different projects.
- Freeform label use: Unvalidated label entry leads to fragmented data that no filter can reliably capture.
The impact on decision-making is direct. A resource allocation report built on incomplete data leads to over-commitment in some teams and idle capacity in others. A risk report that misses two thirds of logged issues gives leadership false confidence.
The fix requires governance, not just better tooling. Reporting tools cannot correct misaligned underlying data. You must audit each project's configuration, standardise field definitions, and enforce naming conventions before aggregation begins. Assign a data steward per project to maintain compliance with the agreed taxonomy.
Pro Tip: Run a five-minute audit by pulling a cross-project filter on a single label or component. Count how many projects return results versus how many you expected. The gap reveals your data inconsistency rate immediately.
What tools and techniques support effective multi-project reporting?
Native project management tools are built for single-project use. Their dashboards, filters, and reports are scoped to one project by design. Extending them to cover multiple projects requires workarounds that break easily with configuration changes and demand constant maintenance.
| Feature category | Entry-level field apps | Enterprise platforms |
|---|---|---|
| Cross-project dashboards | Manual filter assembly | Native, real-time aggregation |
| Data standardisation | User-dependent | Enforced via governance rules |
| AI-assisted risk analysis | Not available | Predictive, automated |
| API integrations | Limited or absent | Broad, configurable |
| Reporting automation | Manual exports | Scheduled, automated delivery |
Centralised reporting platforms that abstract data complexity provide a far more maintainable solution. They pull from multiple sources via APIs, apply consistent field mappings, and present unified views without requiring project teams to change their day-to-day tools.
AI and machine learning are now improving the analytical depth of cross-project reporting. Transfer Graph Convolutional Networks (TGCN), for example, achieved 5.67% better predictive accuracy than traditional single-project baselines in a 2025 study. That improvement comes from the model's ability to align patterns across projects rather than treating each in isolation. The practical implication is that AI-assisted platforms can surface risks in new projects by drawing on patterns from mature ones, a form of cross-project knowledge transfer that manual reporting cannot replicate.
Pocketpmo applies this principle directly. Its AI-driven risk analysis draws on portfolio-wide data to flag emerging issues before they become escalations, giving project managers foresight rather than hindsight.
Pro Tip: When evaluating reporting platforms, test whether the tool enforces data standards at the point of entry or only at the point of reporting. Enforcement at entry prevents the inconsistency problem before it starts.
How to implement cross-project reporting in your organisation
Effective implementation follows a clear sequence. Skipping steps, particularly the data audit, produces reports that look authoritative but mislead. The quality of your decisions depends directly on the quality of the data feeding your reports.
- Conduct a data audit. Review every project's field configuration. Document where labels, priorities, statuses, and date fields diverge from a common standard.
- Define your reporting taxonomy. Agree on a single set of values for priority, status, and label fields. Publish this as a governance document that all project teams must follow.
- Select a centralised reporting solution. Choose a platform that aggregates data via API rather than manual export. Pocketpmo's portfolio management features are designed for exactly this, pulling live data across projects into a single governance layer.
- Define your key performance indicators. Agree on which cross-project performance metrics matter: milestone adherence, resource utilisation, budget variance, and risk exposure are the most common starting points.
- Establish stakeholder responsibilities. Assign a data steward to each project. This person is accountable for maintaining field compliance and flagging deviations.
- Train teams on consistent data entry. A governance policy without training produces inconsistent results. Run short, focused sessions on why field standardisation matters and how it affects the reports leadership uses to make decisions.
- Build your consolidated dashboards. Use your chosen platform to create views that serve different audiences: operational detail for project managers, summary RAG status for sponsors, and trend analysis for PMO leads.
AI project tracking tools can accelerate this process by automating field mapping and flagging anomalies in real time. The goal is a reporting cycle where data flows from projects to portfolio views without manual intervention.
Key takeaways
Cross-project reporting delivers accurate portfolio oversight only when the underlying data is standardised and governance is enforced before aggregation begins.
| Point | Details |
|---|---|
| Define reporting taxonomy first | Agree on shared field values for status, priority, and labels before building any cross-project report. |
| Audit data before aggregating | Inconsistent configurations can omit up to two thirds of relevant data, making reports misleading. |
| Choose platforms over workarounds | Centralised tools with API integration outperform manual filters, which break with every configuration change. |
| AI improves cross-project foresight | Transfer learning models draw on mature project data to improve predictions for newer projects. |
| Governance enables tool value | No reporting platform fixes misaligned data. Assign data stewards and enforce standards at the point of entry. |
The uncomfortable truth about cross-project reporting
I have worked with project managers who invested significantly in reporting platforms, only to find their portfolio dashboards were confidently wrong. The data looked clean. The charts were polished. The underlying field configurations were a mess.
The uncomfortable truth is that most cross-project reporting failures are governance failures, not technology failures. Teams assume that a better tool will solve the problem. It will not. A platform that aggregates inconsistent data faster simply produces misleading reports faster.
What I have found actually works is treating data standardisation as a project in its own right. Give it a sponsor, a timeline, and a definition of done. The organisations that do this, even with modest tooling, produce more reliable portfolio insights than those running expensive platforms on misaligned data.
The emerging AI capabilities in platforms like Pocketpmo are genuinely useful, particularly for risk foresight and pattern recognition across projects. But they amplify good data. They do not rescue bad data. Invest in leadership alignment around data governance first, then let the technology do what it does well.
The shift I am seeing in 2026 is that the best PMOs are treating their data taxonomy as a living asset, reviewed quarterly and owned at the portfolio level. That discipline is what separates organisations that get genuine value from cross-project reporting from those that produce impressive-looking reports nobody trusts.
— Danny
Pocketpmo and cross-project reporting
Pocketpmo is built for project managers and PMOs who need accurate, real-time visibility across multiple projects without building a reporting infrastructure from scratch.
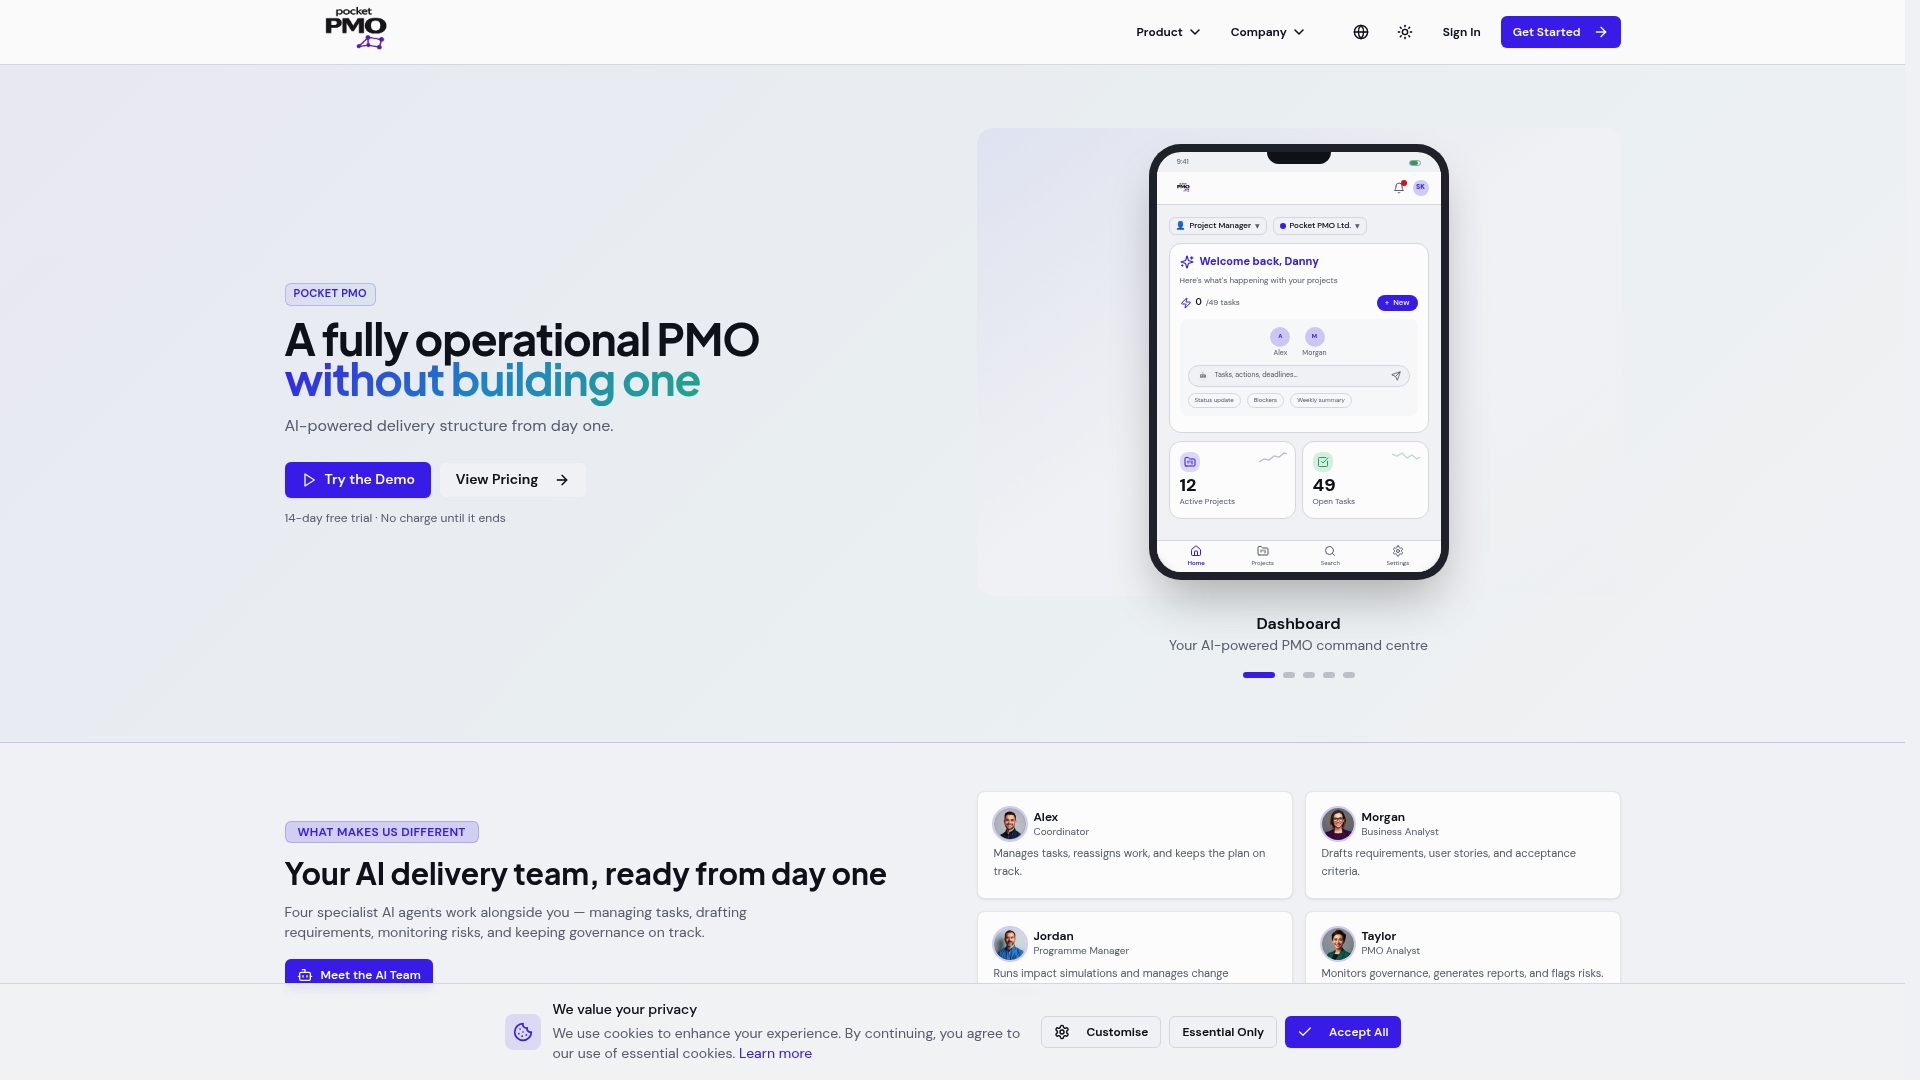
The platform aggregates live project data into consolidated dashboards, enforces governance through structured workflows, and applies AI-driven analysis to surface risks and performance trends across your entire portfolio. You get cross-project oversight without manual exports, brittle filters, or spreadsheet reconciliation. If you are evaluating how Pocketpmo compares to other tools in terms of multi-project reporting capability, the detailed platform comparison covers the key feature differences. The result is a PMO-grade reporting capability available from day one.
FAQ
What is cross-project reporting in project management?
Cross-project reporting is the aggregation of data from multiple projects into a single view, covering status, resources, risks, and financials. It gives project managers and PMOs portfolio-level visibility that individual project reports cannot provide.
Why are cross-project reports often inaccurate?
Inconsistent project configurations are the primary cause, with varied labels, priorities, and field usage causing reports to omit large portions of relevant data. Standardising fields before aggregation is the only reliable fix.
What data should a cross-project report include?
A cross-project report should include milestone status, resource allocation, risk and issue logs, budget versus actuals, and inter-project dependencies. The exact metrics depend on your stakeholders' reporting needs and the KPIs agreed at portfolio level.
How does AI improve cross-project reporting?
AI models, including transfer learning approaches, improve predictive accuracy by drawing on patterns from mature projects to inform analysis of newer ones. Predictive accuracy gains of over 5% have been demonstrated in 2025 research compared to single-project baselines.
How do I start implementing cross-project reporting?
Begin with a data audit across all projects to identify field inconsistencies, then define a shared reporting taxonomy. Select a centralised platform that aggregates via API, assign data stewards, and train teams on consistent data entry before building your dashboards.