
Volume is not the same as value. Many PMOs generate status updates, progress reports, and portfolio summaries week after week, yet stakeholders still feel uncertain about project health. The real problem is not a lack of data. It is a lack of the right data, presented in a way that actually supports decisions. This article breaks down how effective PMO reporting works, which frameworks make it reliable, and how AI is shifting the entire discipline towards faster, more trustworthy governance.
Table of Contents
- Why reporting matters in a PMO
- Essential reporting methodologies and frameworks
- Pitfalls and challenges: avoiding the watermelon effect
- AI optimisation: the future of reporting and governance
- Choosing the right reporting strategy for your PMO
- What most PMOs overlook: quality over quantity in reporting
- Advance your PMO with next-level reporting tools
- Frequently asked questions
Key Takeaways
| Point | Details |
|---|---|
| Reporting drives decisions | Effective reporting is the backbone of PMO governance, enabling real accountability and data-driven progress. |
| AI unlocks efficiency | Integrating AI cuts manual work, improves accuracy, and delivers timely insights for better project outcomes. |
| Beware hidden risks | Seemingly positive reports can mask underlying issues if data quality and transparency are not prioritised. |
| Choose methods wisely | Adopt the right combination of EVM, KPIs, and automated tools to match your organisation’s needs and maturity. |
Why reporting matters in a PMO
Reporting is not an administrative task you do at the end of a project cycle. It is the mechanism through which your PMO maintains control, ensures accountability, and protects stakeholders from unwelcome surprises. Without structured reporting, risks accumulate silently, budgets drift, and teams operate in isolation.
Effective PMO reporting delivers three core benefits:
- Visibility: A clear, real-time picture of where every project stands across your portfolio
- Accountability: Named owners for milestones, risks, and actions, so nothing falls through the gaps
- Risk management: Early warning signals that allow the team to intervene before small problems escalate
Timely, accurate reporting also aligns stakeholders by giving them a shared version of the truth. When your sponsor, delivery team, and finance lead are all working from the same data, decision-making becomes faster and more confident. The multi-project management process depends heavily on this kind of synchronised reporting to keep complex portfolios on track.
The frameworks that underpin strong reporting include Earned Value Management (EVM) with its core metrics of Cost Performance Index (CPI), Schedule Performance Index (SPI), Earned Value (EV), and Planned Value (PV), alongside standardised KPI templates and portfolio dashboards. These tools integrate scope, schedule, and cost into a single, coherent picture rather than three separate conversations.
"The PMO reporting function exists to translate raw project data into governance intelligence. When that translation fails, leadership makes decisions based on assumptions rather than facts."
The distinction matters. Governance intelligence is actionable. Raw data is just noise until it has been structured, contextualised, and surfaced at the right moment for the right person.
Essential reporting methodologies and frameworks
Once you understand why reporting matters, the next step is choosing which frameworks to build around. The most effective PMO reporting systems combine a quantitative backbone with contextual overlays.
Earned Value Management is the quantitative backbone most PMOs rely on. Here is what the core EVM metrics actually tell you:
| Metric | What it measures | Healthy signal |
|---|---|---|
| Earned Value (EV) | Work completed in budget terms | EV matches or exceeds PV |
| Planned Value (PV) | Budgeted cost of scheduled work | Baseline reference point |
| Cost Performance Index (CPI) | Budget efficiency | CPI above 1.0 |
| Schedule Performance Index (SPI) | Schedule efficiency | SPI above 1.0 |
A CPI of 0.85 tells you immediately that you are spending £1 for every 85p of value delivered. That is a clear, actionable signal. Narrative-only reports rarely surface this with the same precision.
Key methodologies also include standardised templates, KPI libraries, and portfolio dashboards, all of which reduce the manual effort of report production while increasing consistency across projects. When every project manager uses the same template, aggregating data at portfolio level becomes straightforward rather than laborious.
Here is a practical step-by-step for implementing an EVM and KPI-based reporting system in your PMO:
- Define your baseline. Establish the project scope, schedule, and budget as a fixed reference point before any work begins.
- Select your KPIs. Choose a limited set of metrics that reflect your organisation's priorities. Fewer, well-chosen indicators outperform sprawling dashboards.
- Standardise your templates. Introduce project proposal templates and status report formats that every project must follow from initiation.
- Automate data collection. Connect your project tools so that EV and PV figures populate automatically rather than being entered manually each week.
- Build your dashboard. Create a portfolio-level view that aggregates individual project metrics into a single governance screen.
- Establish a reporting cadence. Set weekly or fortnightly reporting checkpoints with clear deadlines and named responsibilities.
- Review and iterate. Treat your reporting framework as a living system. Revisit KPI choices quarterly to ensure they still reflect what matters.
This structured approach turns reporting from a reactive chore into a proactive governance tool.

Pitfalls and challenges: avoiding the watermelon effect
Methodology alone does not guarantee reporting integrity. Even well-designed systems can produce misleading outputs when the culture or the data behind them is flawed.
The most dangerous reporting failure in project management is known as the watermelon effect. This is when project metrics appear green on the outside, showing everything on track, but the internal reality is red. Risks are hidden, deadlines are being quietly missed, and the team knows there is a problem that the dashboard does not reflect. Leadership, reassured by green RAG statuses, does not intervene until the situation is critical.
The watermelon effect usually has one of several root causes:
- Data silos: Teams capture information in disconnected tools that do not feed a central source of truth
- Inconsistent sourcing: Different teams define the same metric differently, making portfolio-level aggregation unreliable
- Manual entry bias: When project managers self-report RAG statuses, there is an incentive to present a rosier picture than reality supports
- Lack of real-time updates: Weekly snapshots miss intra-period shifts that change the risk profile significantly
"A red project that everyone knows about can be managed. A green project hiding red realities cannot."
The antidote is a combination of cultural transparency and structural verification. Start by normalising honest reporting at team level. Then implement cross-data verification, which means comparing self-reported statuses against objective measures such as EVM figures, milestone completion rates, and budget actuals. Where they diverge, investigate.
AI-driven project tracking adds another layer of protection here by flagging anomalies automatically. If a project manager reports green status but the underlying data shows a CPI of 0.78, the system can surface that contradiction without waiting for someone to notice it manually.
Pro Tip: Run quarterly reporting audits across your portfolio. Pull the objective data for three or four completed reporting periods and compare it to the statuses that were reported at the time. Patterns of optimistic reporting become visible quickly, and you can address the underlying causes before they affect live projects.
AI optimisation: the future of reporting and governance
Artificial intelligence is not a future concept for PMO reporting. It is already reshaping how leading organisations gather, analyse, and act on project data. The shift is significant because it moves PMOs from reactive reporting to continuous, predictive oversight.
Here is how AI is being applied in PMO reporting right now:
| AI application | What it does | Tangible benefit |
|---|---|---|
| Automated report generation | Pulls live data and produces status reports without manual input | Saves 3 to 5 hours per project manager per week |
| Anomaly detection | Flags deviations from baseline before they become visible in standard reports | Earlier risk intervention |
| Predictive forecasting | Models likely project outcomes based on current trajectory | Better-informed stakeholder conversations |
| Natural language summaries | Converts data into readable executive briefings automatically | Faster board-level decision-making |
| Sentiment analysis | Analyses team communications to detect early signs of stress or confusion | Proactive team management |
The case for standardising EVM and KPIs, integrating AI for automation, and conducting regular audits for data quality is well established. The organisations that are moving fastest are those that treat AI not as a replacement for human judgement but as a layer of intelligence that makes human judgement more reliable.
House of PMO research draws a useful distinction between directive and supportive PMO models and notes that the future emphasises AI for continuous improvement. This is significant because it means AI benefits are not limited to large, centralised PMOs. Even a supportive PMO operating in a matrixed organisation can use AI tools to improve the consistency and reliability of reporting across teams.
To manage AI project requirements effectively, start with a focused pilot. Choose one project or one reporting process, apply AI tooling to it, and measure the before and after impact on reporting speed, accuracy, and stakeholder satisfaction. Use that evidence to build the case for wider adoption.
The AI-driven features available through modern PMO platforms now include intelligent risk analysis, automated status reporting, and predictive portfolio dashboards, all of which reduce the overhead of manual reporting while increasing the quality of the insights produced.
Pro Tip: Before piloting any AI governance framework, audit your existing data quality first. AI amplifies what is already there. If your data is inconsistent or incomplete, AI-generated insights will reflect that. Clean data is the foundation everything else is built on.
Choosing the right reporting strategy for your PMO
Not every PMO needs the same reporting approach. The right strategy depends on your organisation's structure, decision-making model, and current maturity level.
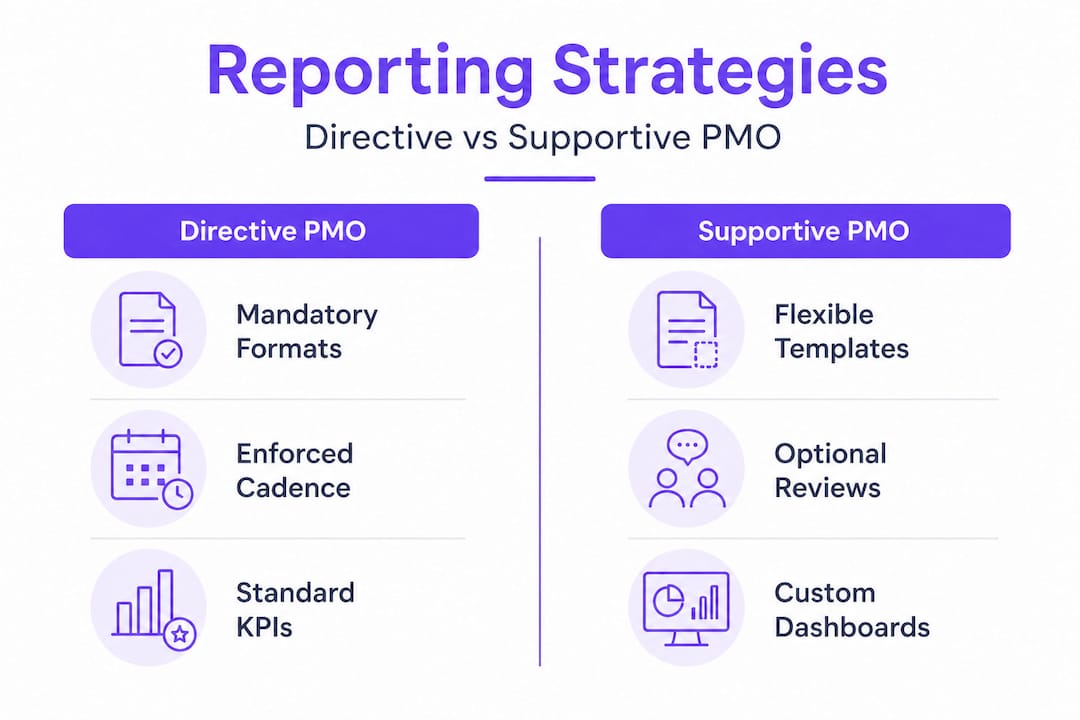
The two dominant models, as outlined by House of PMO, look like this:
| Dimension | Directive PMO | Supportive PMO |
|---|---|---|
| Reporting enforcement | Mandatory formats and cadences | Guidance and templates offered |
| Decision-making | Centralised through the PMO | Distributed across project teams |
| Control level | High | Low to medium |
| Best suited to | Regulated industries, large programmes | Matrixed organisations, creative environments |
| AI adoption approach | Top-down rollout | Opt-in tooling and frameworks |
Choosing between these is not about which is better in absolute terms. It is about which fits your contrasting PMO models and the culture of the organisation you are operating within.
To move towards an AI-optimised, continuous improvement mindset regardless of your starting model, follow these steps:
- Assess your current maturity. Be honest about where your reporting is today. Are data sources reliable? Are KPIs consistently defined? Is there a shared understanding of what good looks like?
- Identify your highest-friction reporting processes. Which reports take the most time to produce? Which ones generate the most stakeholder confusion? Target those first.
- Select tools that match your model. A directive PMO will benefit from enforcement-capable platforms. A supportive PMO needs tools that are easy to adopt voluntarily.
- Pilot before scaling. Test any new framework or AI tool on a contained set of projects before rolling it across the portfolio.
- Build feedback loops. Create a mechanism for project managers and stakeholders to flag when reports are not useful or accurate. This feedback drives continuous improvement.
The goal is not to reach a fixed destination. It is to build a reporting function that gets measurably better each quarter.
What most PMOs overlook: quality over quantity in reporting
Here is an uncomfortable truth. Many PMOs measure their effectiveness by the volume of reports they produce. Longer status updates, more frequent dashboards, and wider distribution lists feel like rigour. They are often the opposite.
Reporting overload masks insight. When stakeholders receive 15-page weekly updates, they scan for exceptions rather than reading for understanding. When project managers spend significant portions of their week compiling reports, they have less time to actually manage projects. The administrative burden of heavy reporting is one of the most underestimated drains on PMO performance.
The organisations that get reporting right focus obsessively on decision-ready information. Every report should answer a specific question that a specific person needs answered in order to take action. If a report does not prompt a decision or an action, it is a cost without a return.
Our view is that true PMO value comes from improving the quality of decisions made, not the quantity of pages filed. AI makes this possible at scale by automating the routine production work and freeing your PMO team to focus on interpretation, communication, and governance. The PMO automation insights available today make this shift more accessible than it has ever been. Experiment with fewer, better reports. Measure stakeholder satisfaction and decision speed, not report volume.
Advance your PMO with next-level reporting tools
Translating these principles into practice requires the right platform behind you. Digital tools that combine real-time dashboards, AI-driven risk analysis, and automated status reporting give your PMO the infrastructure to move from reactive to proactive governance.
Pocket PMO is built for exactly this transition. From PMO launch solutions that get you operational from day one, to AI-driven reporting that automates your routine outputs and surfaces genuine insights, the platform is designed to support both directive and supportive PMO models. Explore the features, request a demo, and see how AI-augmented reporting can reduce overhead while raising the quality of every governance conversation you have.
Frequently asked questions
What is the watermelon effect in PMO reporting?
The watermelon effect is when project reports appear healthy on the surface but hide serious risks or issues internally. It typically occurs due to self-reported RAG statuses that are not cross-verified against objective project data.
How can AI improve PMO project reporting?
AI automates data collection, detects anomalies, and supplies predictive insights, making reports timelier and more reliable. Integrating AI with EVM and KPIs also reduces manual effort and improves data quality across the portfolio.
What are the best frameworks for PMO reporting?
Earned Value Management, KPIs, and standardised portfolio dashboards are among the most widely used PMO reporting frameworks, offering structured, quantitative visibility across scope, schedule, and cost.
Why do PMOs struggle with consistent data quality in reports?
Common causes include data silos, inconsistent sourcing, and insufficient real-time updates, all of which undermine the reliability of even well-designed reporting frameworks.