
Project managers and PMOs often assume that getting data faster automatically leads to better decisions. That assumption is only half right. Real-time project reporting is not simply about speed. It is about visibility, accuracy, and the ability to act on insights before small variances become costly delays. This guide clarifies what real-time reporting actually means in practice, shows you how it compares to periodic approaches, and gives you a concrete framework for integrating AI-driven reporting into your project environment. You will leave with practical steps you can apply immediately, not just theory.
Table of Contents
- Defining real-time project reporting
- Comparing reporting methods: periodic versus real-time
- How AI enhances real-time reporting
- Best practices for implementing real-time reporting
- Why real-time reporting isn't always the answer
- Take your reporting further with Pocket PMO
- Frequently asked questions
Key Takeaways
| Point | Details |
|---|---|
| Real-time reporting defined | It delivers live visibility of project data for faster, smarter decision-making. |
| Periodic versus real-time | Both approaches offer advantages; the best fit depends on project needs and risk. |
| AI’s transformative impact | AI enables predictive insights and speeds up detection of variances and risks. |
| Implementation best practices | Combine automation, regular reviews, and strategic dashboards for optimal results. |
| Balanced approach | Prevent analysis paralysis by mixing real-time and periodic review to maximise accuracy. |
Defining real-time project reporting
Real-time project reporting refers to the continuous, automated collection and presentation of project data as it occurs, rather than at fixed intervals. Instead of waiting for a Monday morning status pack, your dashboards update the moment a task changes status, a risk is logged, or a budget line shifts. The result is a live picture of project health that any stakeholder can access at any point.
This is fundamentally different from traditional periodic reporting, where a project manager consolidates data manually, usually weekly or monthly, and distributes a static document. Periodic reports are snapshots. Real-time reports are a continuous stream. Both have a role, but they serve different purposes, and conflating them leads to wasted investment.

What makes reporting genuinely real-time?
Three technical foundations must be in place:
- Automated data integration: Your project tools, finance systems, resource planners, and risk registers must feed into a single data layer automatically. Manual data entry breaks the chain.
- Live dashboards: The reporting interface must refresh dynamically, not require a user to run a report or export a spreadsheet.
- Upstream process automation: Data is only as good as its source. If team members log time erratically or update tasks inconsistently, even the fastest dashboard will show inaccurate information.
| Reporting type | Data frequency | Typical update method | Latency |
|---|---|---|---|
| Manual periodic | Weekly or monthly | Human consolidation | Days to weeks |
| Automated periodic | Weekly | Scheduled scripts | Hours |
| Near real-time | Daily or hourly | Automated integration | Minutes |
| True real-time | Continuous | Event-driven automation | Seconds |
The table above illustrates that real-time is a spectrum, not a binary. Most project environments operate comfortably in the near real-time or automated periodic tier, and that is perfectly adequate. As the performance reports guidance notes, weekly reviews catch variances early without requiring sub-second data feeds. The lesson: invest in upstream process automation before chasing real-time technology for its own sake.
Exploring AI project tracking strategies can help you understand how intelligent tools sit on top of this data foundation to generate genuine insight, not just faster noise.
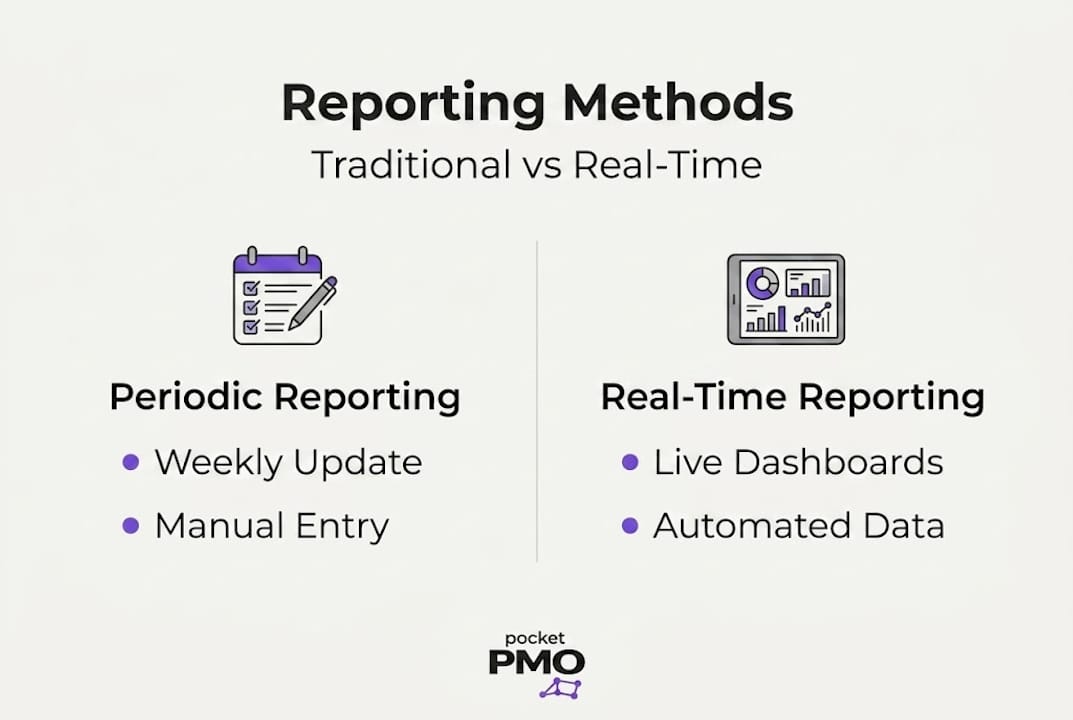
Comparing reporting methods: periodic versus real-time
Now that we know what real-time reporting is, let us see how it stacks up against traditional periodic approaches.
Periodic reporting
Periodic reporting has served project managers well for decades. A structured weekly or monthly report, produced at a fixed time, offers several genuine advantages: it creates a predictable rhythm for stakeholders, it forces a deliberate review moment, and it reduces information overload. Tools like spreadsheet templates, email status updates, and slide decks are common. The main weakness is lag. By the time a variance appears in a weekly report, it may already be too late to intervene without cost or schedule impact.
Real-time reporting
Real-time reporting removes that lag. Dashboards surface issues the moment they emerge. A budget overrun at task level, a delayed milestone, or a newly flagged risk appears on your screen immediately, not next Friday. The trade-off is setup complexity and the risk of overwhelming your team with constant data. Not every project needs instant visibility. A low-risk internal initiative with a stable scope rarely justifies the infrastructure cost of true real-time dashboards.
Side-by-side comparison
| Factor | Periodic reporting | Real-time reporting |
|---|---|---|
| Visibility | Lagged snapshot | Continuous live view |
| Accuracy | Depends on manual input | Depends on data integration quality |
| Team workload | Higher at report time | Spread across the lifecycle |
| Stakeholder responsiveness | Reactive | Proactive |
| Setup complexity | Low | Medium to high |
| Best suited for | Stable, lower-risk projects | Complex, multi-workstream delivery |
Choosing between them comes down to three factors:
- Project complexity: Multi-project portfolios with interdependencies benefit most from real-time visibility.
- Risk profile: High-risk projects, where a delayed variance detection can cascade quickly, justify real-time investment.
- Stakeholder needs: Executive sponsors who need frequent assurance will appreciate live dashboards. Smaller internal teams may prefer a clean weekly summary.
According to performance reports research, investing in upstream process automation before layering on real-time technology consistently delivers better data quality and fewer costly surprises.
Pro Tip: Before adopting any real-time reporting tool, audit your current data entry habits. If your team does not update tasks consistently, a faster dashboard simply shows inaccurate data faster. Start by installing automation at the process level first, then introduce live reporting on top of reliable data.
You can explore broader thinking on this topic through the project management blog, or review specific project reporting features that support both periodic and real-time outputs. For a practical view of what blended reporting looks like in action, the growth consulting insights perspective on decision quality is worth reading alongside the technical setup.
If you want to see how AI further transforms this landscape, the AI team demo is an excellent starting point before committing to any platform.
How AI enhances real-time reporting
Once the reporting platform is selected, the next step is maximising its value with artificial intelligence.
AI does not just present data faster. It processes vast volumes of project information simultaneously, identifies patterns that would take a human analyst hours to spot, and surfaces actionable recommendations rather than raw figures. For project managers and PMOs overseeing multiple concurrent initiatives, this is a significant shift in capability.
Predictive analytics in practice
Traditional reporting tells you what has happened. AI-powered reporting tells you what is likely to happen next. For example, if your scheduling data shows that a particular workstream consistently falls behind in weeks four to six of a project lifecycle, the AI can flag this pattern early in a new project and recommend a proactive resource intervention. You act before the delay materialises, not after.
Predictive analytics also applies to budget forecasting. Rather than waiting for an end-of-month cost report to reveal an overrun, AI models can detect spending velocity trends and project when a budget line will breach its threshold, giving you days or weeks to respond.
Automated recommendations
AI does not just flag issues. It suggests responses. A well-integrated AI reporting layer might recommend reallocating resource hours from one workstream to a critical path task, based on current velocity and remaining scope. It can identify which risks are most likely to escalate based on historical data and prompt your team to take a specific mitigation action.
This moves your PMO from a reporting function to a genuinely proactive delivery partner. The shift is significant for organisations managing portfolios where manual oversight simply cannot scale.
Key benefits of integrating AI into reporting
- Faster variance detection: AI processes event-driven data continuously, reducing the time between a variance occurring and it being visible to decision-makers.
- Reduced manual effort: Automated data aggregation and narrative generation eliminate hours of manual report preparation each week.
- Improved risk foresight: Predictive models draw on historical project data to surface risks earlier in the delivery lifecycle.
- Smarter resource allocation: AI identifies capacity gaps and recommends reallocation before bottlenecks form.
- Consistent reporting quality: Automated outputs remove the inconsistency that comes from different team members producing reports in different formats.
Pairing AI project tracking techniques with a well-integrated data layer gives your PMO a genuine competitive advantage. You can also explore practical project use cases to see how organisations are applying these capabilities across different sectors and project types.
As performance reports research confirms, balancing speed with accuracy through upstream automation is the foundation that makes AI-enhanced reporting reliable rather than misleading.
Best practices for implementing real-time reporting
With AI in place, let us look at actionable steps for ensuring your real-time reporting delivers on its promise.
Five-step process to roll out real-time reporting
-
Define your reporting strategy first. Before selecting any tool, clarify what decisions your dashboards need to support. Who needs what information, at what frequency, and in what format? A dashboard designed for an executive sponsor looks very different from one used by a delivery team lead. Align your reporting architecture to specific decision-making needs, not to what the tool can theoretically show.
-
Automate your upstream data processes. This cannot be overstated. Real-time dashboards built on inconsistent manual data will mislead rather than inform. Automate task status updates, risk logging, time tracking, and budget capture before you invest in any reporting layer. This single step typically has the highest impact on reporting quality.
-
Introduce dashboards incrementally. Start with one or two key metrics per stakeholder group. Resist the temptation to display everything the platform can capture. Information overload is a genuine risk when real-time visibility is new to your team. Pilot with a single project, gather feedback, and expand from there.
-
Establish a blended review rhythm. Real-time dashboards and structured weekly reviews are not mutually exclusive. Use your dashboards for continuous monitoring and early intervention, and use weekly reviews to interpret trends, validate AI recommendations, and make strategic decisions. This combination delivers the best of both approaches.
-
Build a reporting culture alongside the technology. Tools only work when people trust and use them. Invest time in onboarding your team, explaining what the dashboards show, and demonstrating how early intervention benefits everyone. A culture that values transparent, data-driven reporting will get far more from real-time technology than one where dashboards are viewed with suspicion.
Common pitfalls to avoid
- Overwhelming teams with data: More metrics do not equal more insight. Curate your dashboards ruthlessly.
- Relying on incomplete data: A real-time view of incomplete data is worse than a weekly review of accurate data. Fix the input before investing in the output.
- Treating AI recommendations as instructions: AI surfaces options. Your experienced project managers still make the final call, using their contextual knowledge.
Pro Tip: Layer your reporting. Use real-time dashboards for operational monitoring and daily decisions, and reserve your structured weekly review for strategic interpretation. This approach, validated by performance reports research, catches variances early while preventing the analysis paralysis that comes from reacting to every data fluctuation.
When starting a new project, well-structured project proposal templates help you define reporting requirements from the outset, ensuring your real-time setup is scoped correctly. For organisations running several initiatives simultaneously, the principles in multi-project management are directly applicable to building scalable reporting architectures.
Why real-time reporting isn't always the answer
Here is a candid perspective on the limits and opportunities of real-time project reporting.
The project management community has developed something of an obsession with real-time data. Platform vendors, consultants, and industry publications often present it as an unqualified good: faster data, better decisions, full stop. Our experience suggests the relationship is more nuanced than that.
Teams that chase real-time visibility without first establishing data discipline tend to create more noise, not less. Every dashboard refresh becomes a potential distraction. Every micro-variance triggers a conversation that may not need to happen. The result can be a PMO that is permanently firefighting rather than strategically directing.
The smarter path is a blended approach. As AI tracking perspectives confirm, pairing automated monitoring with structured human review cycles consistently outperforms either approach alone. Performance reports research reinforces this: upstream process automation, combined with disciplined weekly reviews, delivers variance detection that is both accurate and actionable.
Real-time reporting is a powerful tool. Use it deliberately, not reflexively.
Take your reporting further with Pocket PMO
If you are ready to move from theory to action, Pocket PMO is designed for exactly this challenge.
Pocket PMO brings together real-time dashboards, AI-driven risk analysis, and automated status reporting in a single platform, removing the need to build your own PMO infrastructure. You can explore features that cover everything from portfolio management to change request workflows, or review see use cases to find examples relevant to your sector. When you are ready to take the next step, launch Pocket PMO and start improving your project visibility from day one. Your team deserves reporting that works for them, not against them.
Frequently asked questions
How does real-time project reporting improve decision-making?
Real-time project reporting gives managers immediate visibility into project performance, so issues are identified and addressed before they escalate. Paired with performance reports discipline around upstream data quality, it enables faster and more accurate decisions.
What technical tools are needed for real-time project reporting?
You typically need automated data collection systems integrated with live dashboards and analytics platforms. Without reliable upstream automation, even the most sophisticated dashboard will surface inaccurate information.
Is real-time reporting suitable for every project?
Not always. Projects with lower risk profiles or slower-moving scope changes often gain more value from structured weekly reviews than from continuous live dashboards. Match your reporting approach to your project's complexity and stakeholder needs.
How can AI make real-time project reporting more effective?
AI analyses incoming project data for patterns and predicts risks or resource shortfalls before they become critical, as supported by performance reports findings. This shifts your team from reactive reporting to proactive delivery management.