
Missed deadlines, confused stakeholders, and last-minute surprises share a common root cause: ineffective project status reporting. When project managers lack a structured approach to communicating progress, risk, and decisions, the entire project ecosystem suffers. This guide gives you practical methodologies, tools, and templates to sharpen your reporting, close visibility gaps, and give stakeholders the confidence they need to make timely decisions. Whether you lead a single project or oversee a busy PMO, what follows will help you move from reactive updates to genuinely strategic reporting.
Table of Contents
- What is project status reporting and why does it matter?
- Tools, templates, and key methodologies for status reporting
- Step-by-step guide: How to deliver impactful project status reports
- Common mistakes, troubleshooting, and latest trends
- The uncomfortable truth: Why PMO reporting must evolve fast
- How Pocket PMO streamlines status reporting
- Frequently asked questions
Key Takeaways
| Point | Details |
|---|---|
| Visibility is vital | Clear status reports enable early issue detection and stakeholder alignment. |
| Choose the best tools | Select RAG indicators, Gantt charts, or EVM based on project type and audience. |
| Standardise with templates | PMO consistency is achieved by using standard report formats and templates. |
| Balance detail and clarity | Avoid overloading reports—tailor depth and format to stakeholder needs. |
| Embrace automation and AI | Modern PMOs use predictive analytics to forecast trends and save reporting time. |
What is project status reporting and why does it matter?
Project status reporting is the structured process of communicating a project's current condition to stakeholders, including progress against milestones, budget consumption, risks, issues, and decisions required. It is not simply a progress update. Done well, it is a mechanism for governance, accountability, and early intervention.
Consider what happens without it. Teams work in silos. Sponsors receive conflicting information. Issues escalate unchecked. By the time the right person knows there is a problem, the damage is already done. A robust reporting process prevents precisely this.
The core benefits of disciplined status reporting include:
- Early issue surfacing — problems are visible before they become crises
- Stakeholder alignment — everyone operates from the same picture of project health
- Informed decision-making — sponsors and steering committees have the data they need, when they need it
- Accountability — teams and workstream leads are clear on their commitments
- Audit trail — decisions and changes are documented over time
"Effective status reporting enhances visibility and decision-making by surfacing issues early, aligning stakeholders, and enabling proactive adjustments. PMOs should prioritise automation and standardisation to free time for analysis."
The distinction between reporting and analysing is important. When your team spends hours compiling data manually, they have no time left to interpret it. This is why automation and standardisation sit at the heart of every high-performing PMO. Pair your reporting process with solid project proposal templates from the start, and you build consistency into the project lifecycle from day one.
Good reporting is not about volume. It is about signal over noise, delivering the right information to the right person at the right time.
Tools, templates, and key methodologies for status reporting
With the importance established, let's explore the most effective tools and techniques for reporting project status.
The most widely used reporting methodologies in project management share one quality: they turn complex data into clear, actionable communication. The three principal visual and quantitative approaches are:
- RAG indicators (Red, Amber, Green) — colour-coded status flags that instantly communicate project health across scope, schedule, budget, and risk dimensions
- Gantt charts — timeline-based visuals that show task dependencies, milestone progress, and schedule variance at a glance
- Burn-down charts — used in agile environments to track remaining work against time, making sprint or release progress immediately visible
- Earned value management (EVM) — a quantitative analysis technique that compares planned value, earned value, and actual cost to measure schedule and cost performance precisely
Each methodology serves a purpose. RAG indicators are fast and readable for executive audiences. EVM provides the rigour needed for complex, large-scale programmes where financial accountability is critical. Burn-downs work best in iterative delivery environments. Understanding your project context helps you choose the right tool, and in many cases, combining them produces the clearest picture.
Tailoring your format to your audience
Not all stakeholders need the same report. Sending a 20-page EVM analysis to a busy executive sponsor is a guaranteed path to disengagement. Equally, giving a delivery team only a RAG summary leaves them without the detail they need to act.

The principle is simple: match depth to decision-making authority.
| Audience | Format | Frequency | Key content |
|---|---|---|---|
| Executive sponsor | One-page summary with RAG | Monthly | Status, risks, decisions required |
| Steering committee | Dashboard with KPIs | Monthly or quarterly | Budget, milestones, strategic risks |
| Project team | Detailed task update | Weekly | Tasks, blockers, dependencies |
| PMO portfolio view | Aggregated RAG across projects | Weekly | Cross-project risks and resource issues |
When managing multiple projects simultaneously, standardised templates become essential. Without them, every project manager invents their own format, and the PMO spends its time reformatting rather than analysing. Standardisation also makes onboarding faster and governance reviews smoother.
Pro Tip: Use visuals wherever possible. A well-constructed dashboard communicates in seconds what a written paragraph communicates in minutes. Busy stakeholders respond to clarity, not comprehensiveness.
A good template for a standard status report should include: report date, reporting period, overall RAG status, milestone summary, budget position, top three risks, issues requiring escalation, and decisions needed. Keeping it consistent across your proposal template guide and status reporting processes reinforces governance discipline from initiation through delivery.
Step-by-step guide: How to deliver impactful project status reports
Now that you know the tools and methodologies, let's break down how to deliver status reports that engage stakeholders and drive action.
The quality of a status report depends heavily on the process behind it. A rushed, last-minute update with unverified data does more harm than good. Here is a structured, repeatable approach:
- Set your reporting cadence — agree the frequency at project initiation. Weekly for active delivery phases, monthly for planning or steady-state periods. Never let the cadence slip without communicating the reason.
- Gather data from the right sources — pull actual progress data from your project tracking system, not from memory. Use task completion rates, budget actuals, and RAID logs.
- Apply your chosen methodology — assign RAG statuses based on agreed thresholds, calculate EVM metrics if relevant, and update your Gantt or burn-down chart.
- Write the narrative summary — numbers tell you what happened; the narrative tells you why and what comes next. Keep it concise, factual, and forward-looking.
- Identify decisions and escalations — never leave a status report without a clear "decisions required" section. This transforms reporting from a passive exercise into an active governance tool.
- Distribute and confirm receipt — send the report through your agreed channel and confirm key stakeholders have read it before the next review meeting.
- Archive for audit and trend analysis — store every report in a consistent location. Over time, archived reports reveal patterns in risks, delays, and team performance.
Strong measurement and reporting correlates directly with higher project success rates. The critical shift is focusing on benefits realisation, not just activity tracking. Telling a sponsor that "80 tasks were completed this week" is meaningless without context. Telling them that "the system integration milestone is on track to deliver the planned efficiency savings by Q3" connects activity to value.
Consider a practical example. A digital transformation programme is running two weeks behind schedule on a key data migration workstream. A weak status report states: "Data migration is delayed." A strong status report states: "Data migration is Amber. We are two weeks behind plan due to a source data quality issue. The team is implementing a data cleansing process, and we expect to recover five days by the end of the month. No impact to the go-live date is anticipated, but escalation to the technical director is recommended to release additional resource."
The difference is clarity, context, and actionability. Pair this approach with effective requirements management to ensure your reports reflect real delivery progress, not just effort.
Pro Tip: Avoid information overload. The temptation to include everything is strong, but restraint is more effective. A report that raises three clearly articulated issues will drive three decisions. A report that raises twenty will drive none.
Explore AI project tracking strategies to see how automation can reduce the manual effort behind steps one through three significantly.
Common mistakes, troubleshooting, and latest trends
Having mastered the stepwise process, let's look at mistakes to avoid, how to troubleshoot, and future trends shaping project reporting.
Even experienced project managers fall into predictable traps with status reporting. Recognising them early saves time, credibility, and often the project itself.
Common mistakes to avoid:
- Over-reporting — too much detail, too frequently, overwhelms stakeholders and causes report fatigue
- Under-reporting — sparse updates leave stakeholders in the dark and breed mistrust
- Sanitising the truth — reporting everything as Green when issues exist destroys credibility the moment reality surfaces
- Reporting activity, not progress — listing tasks completed without linking them to milestones or outcomes adds no governance value
- Inconsistent formats — changing your template every month forces readers to relearn the structure rather than focus on the content
- Delayed delivery — a report that arrives two days after the review meeting it was meant to inform is worthless
"Balance brevity versus depth: overly detailed reports are ignored, while sanitised ones erode trust. The most effective reports sit precisely in the middle, honest, concise, and action-oriented."
Troubleshooting common scenarios:
If stakeholders are ignoring your reports, the format is likely the problem. Shorten it, add visual indicators, and put the most critical information at the top. If your PMO is struggling with inconsistent reporting across projects, introduce a mandatory template and a brief quality-check process before reports are distributed.
Classic versus modern reporting approaches
The landscape of project status reporting is shifting rapidly. Predictive analytics and AI are no longer future possibilities. They are available tools that forward-thinking PMOs are deploying right now.
| Dimension | Classic reporting | Modern AI-driven reporting |
|---|---|---|
| Data collection | Manual, time-consuming | Automated, real-time |
| Risk identification | Reactive, spotted post-event | Predictive, flagged before impact |
| Format | Static document or spreadsheet | Dynamic dashboard, live updates |
| Stakeholder tailoring | Manual reformatting | Automated audience-specific outputs |
| Trend analysis | Periodic, retrospective | Continuous, forward-looking |
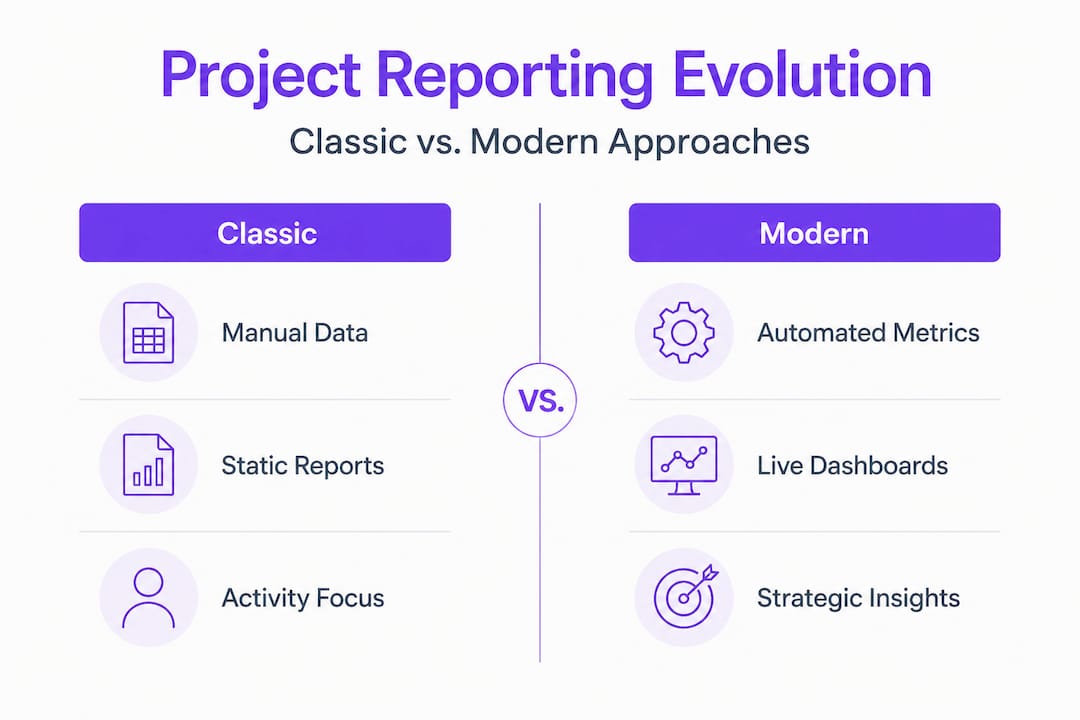
PMO reporting has been shifting from status and activity tracking towards benefits and strategy tracking. The organisations that lead this shift are those investing in automation, standardisation, and AI-assisted forecasting. Those that cling to manual, spreadsheet-driven reporting are spending valuable analyst time on formatting rather than insight.
Connecting your reporting process to requirements for AI success ensures that the data feeding your reports is structured, reliable, and ready for intelligent analysis.
The uncomfortable truth: Why PMO reporting must evolve fast
Here is the honest take that many PMO guidance articles avoid: most organisations are still reporting on activity, not outcomes. Weekly status packs full of task completion percentages and milestone traffic lights give the appearance of governance without delivering its substance.
Benefits realisation over activity tracking is not a new concept, but it remains stubbornly underimplemented. The reason is cultural, not technical. Reporting activity is comfortable because it is measurable and rarely contentious. Reporting on whether a project is actually delivering its intended business value requires courage, because sometimes the honest answer is "not yet" or "we need to revisit the business case."
PMO leaders who make this shift see a genuine change in stakeholder engagement. Sponsors stop skimming reports and start reading them. Steering committees ask sharper questions. Delivery teams connect their daily work to strategic outcomes. That is what effective reporting is supposed to produce.
Automation is the enabler that makes this shift practical. When your team is not spending three hours every Friday compiling a status pack, they have time to analyse trends, identify emerging risks, and prepare genuine strategic insights. The technology to do this exists today. The question is whether your PMO is ready to use it.
Explore the PMO use cases that demonstrate how this shift from activity reporting to strategic insight plays out in practice across different industries and project types.
How Pocket PMO streamlines status reporting
Transforming your status reporting process does not require months of configuration or a large internal team. Pocket PMO gives you the automation, templates, and real-time visibility tools to make impactful reporting the default, not the exception.
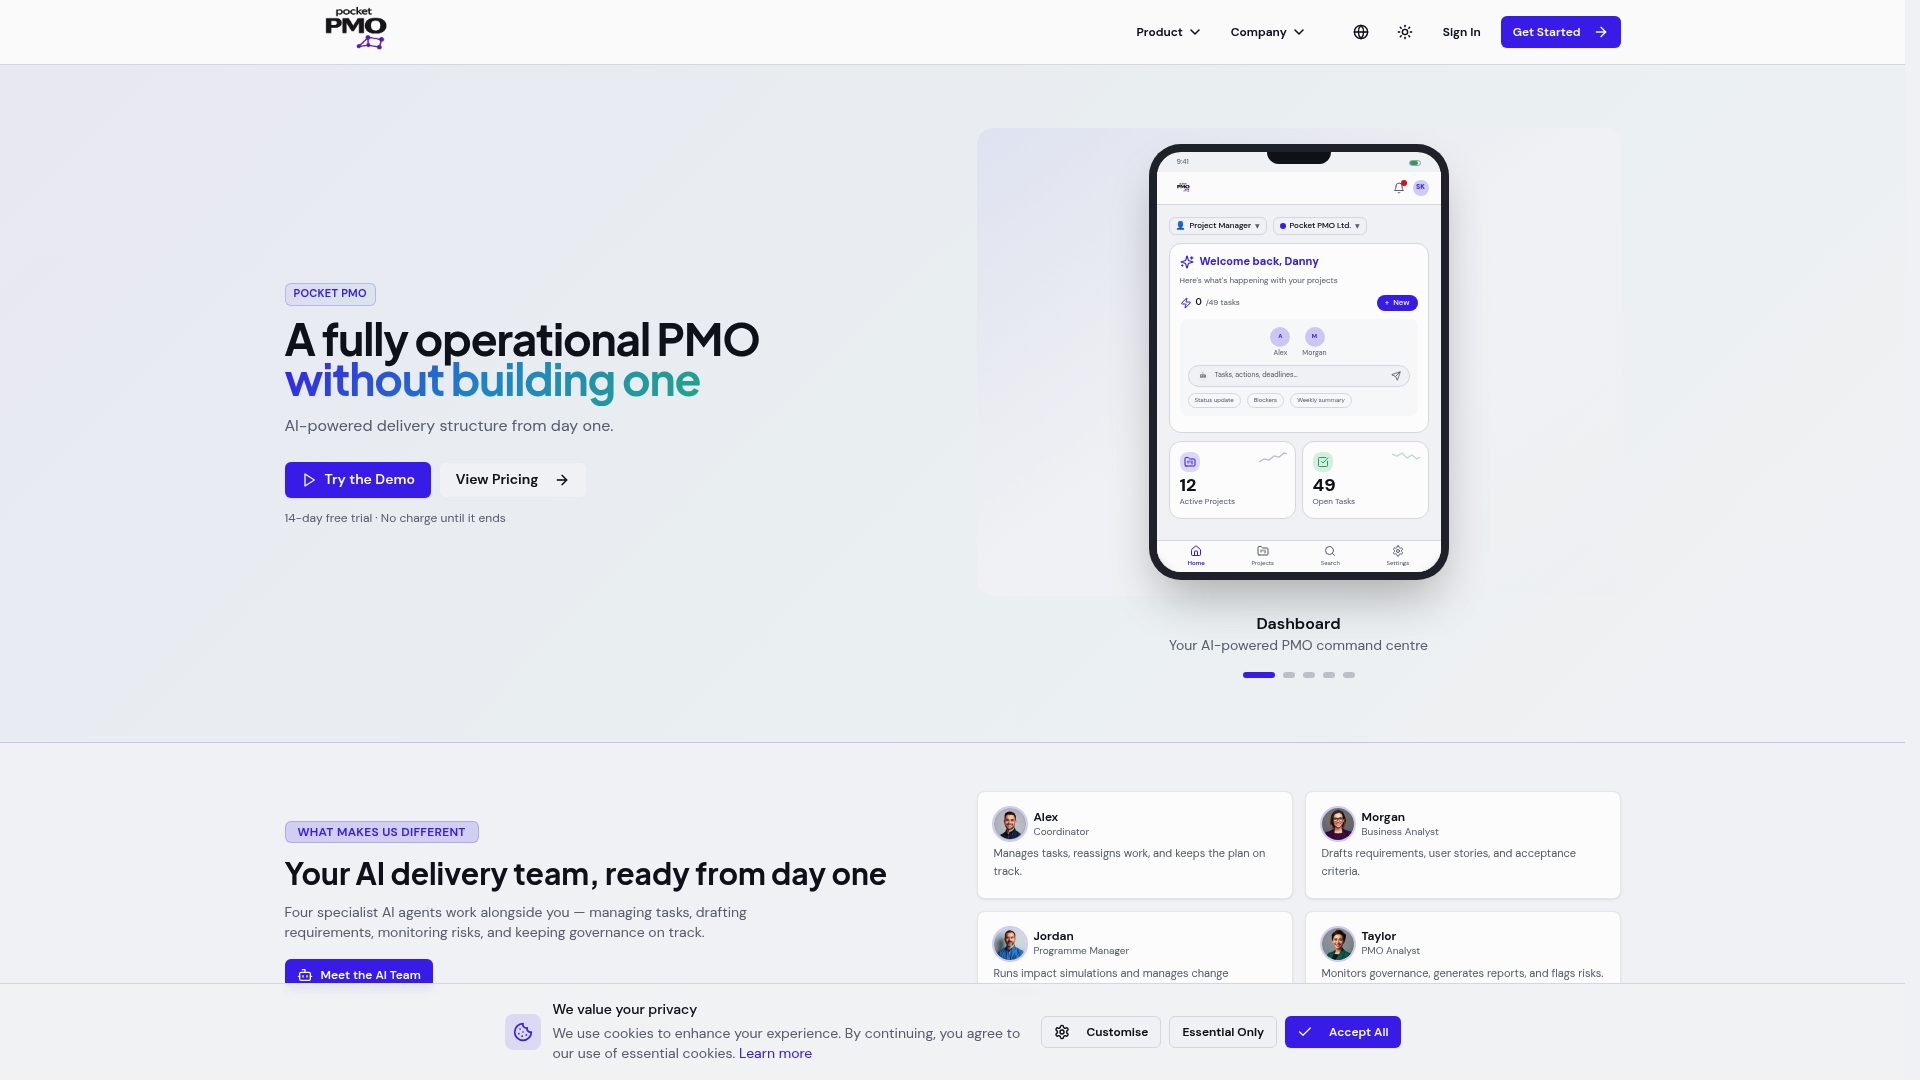
With Pocket PMO, you can auto-generate standardised status reports, apply RAG indicators across your portfolio, and deliver audience-specific dashboards without manual reformatting. The platform's AI-driven insights surface risks early, track benefits realisation, and keep stakeholders aligned through every phase of delivery. Launch your PMO capability quickly and explore the full suite of reporting and tracking features designed to give project managers and PMO leaders the visibility and decision-making confidence they need from day one.
Frequently asked questions
What is the RAG indicator in project status reporting?
RAG stands for Red, Amber, Green — colour-coded indicators used to quickly communicate project health across key dimensions such as scope, schedule, budget, and risk, enabling stakeholders to assess status at a glance.
How often should project status reports be delivered?
Reports are typically delivered weekly or monthly, and should be tailored to stakeholder needs and project complexity, with executive summaries at a lower frequency than detailed team updates.
Why do many status reports fail to influence project outcomes?
Overly detailed reports are ignored, while sanitised reports erode trust; the most effective reports balance honesty with conciseness, focusing on actionable decisions and forward-looking context.
What is earned value management (EVM)?
Earned value management is a quantitative performance technique that compares planned value, earned value, and actual cost to give project managers a precise, data-driven view of schedule and budget performance.
How is AI used in project status reporting?
AI and predictive analytics tools are increasingly used to automate data collection, forecast project outcomes, identify risks before they escalate, and generate audience-specific reports without manual effort.