

Professionals who work with environmental data, compliance reporting, or sustainability projects encounter the term ppm constantly. Yet it is frequently misread, misapplied, or dismissed as a concern for chemists rather than project managers. That assumption is costly. PPM, which stands for parts per million, is a precise unit of measurement that quantifies trace concentrations of one substance within another. Whether you are overseeing a construction project with air quality obligations, managing a water treatment programme, or building sustainability metrics into a portfolio dashboard, understanding ppm is not optional. It shapes the decisions you make and the risks you report.
Table of Contents
- Key takeaways
- What is ppm and how is it calculated?
- Why ppm matters in environmental and industrial projects
- The nuances that trip up experienced teams
- Applying ppm knowledge in project portfolio management
- My perspective: ppm is a governance tool, not just a metric
- How Pocketpmo supports precise ppm data in your projects
- FAQ
Key takeaways
| Point | Details |
|---|---|
| PPM is a precision tool | One ppm equals one unit of a substance per million units of the total, making it ideal for trace-level measurements. |
| Calculation varies by medium | Gas and liquid ppm use different formulas; confusing them produces inaccurate results with real compliance consequences. |
| Context determines significance | One ppm of chlorine gas is harmful; one ppm of CO₂ is negligible. Always interpret ppm relative to the substance. |
| Integration into project reporting | Embedding ppm data in dashboards and risk registers improves environmental compliance and stakeholder communication. |
| AI platforms add precision | Modern project tools can automate ppm data tracking and flag threshold breaches before they become reportable incidents. |
What is ppm and how is it calculated?
PPM sits in the middle of a measurement scale between percentage concentrations and parts per billion. That position makes it the default unit for environmental regulations, water quality standards, and industrial safety thresholds worldwide.
The standard formula is straightforward:
PPM = (Mass of solute ÷ Mass of solution) × 1,000,000
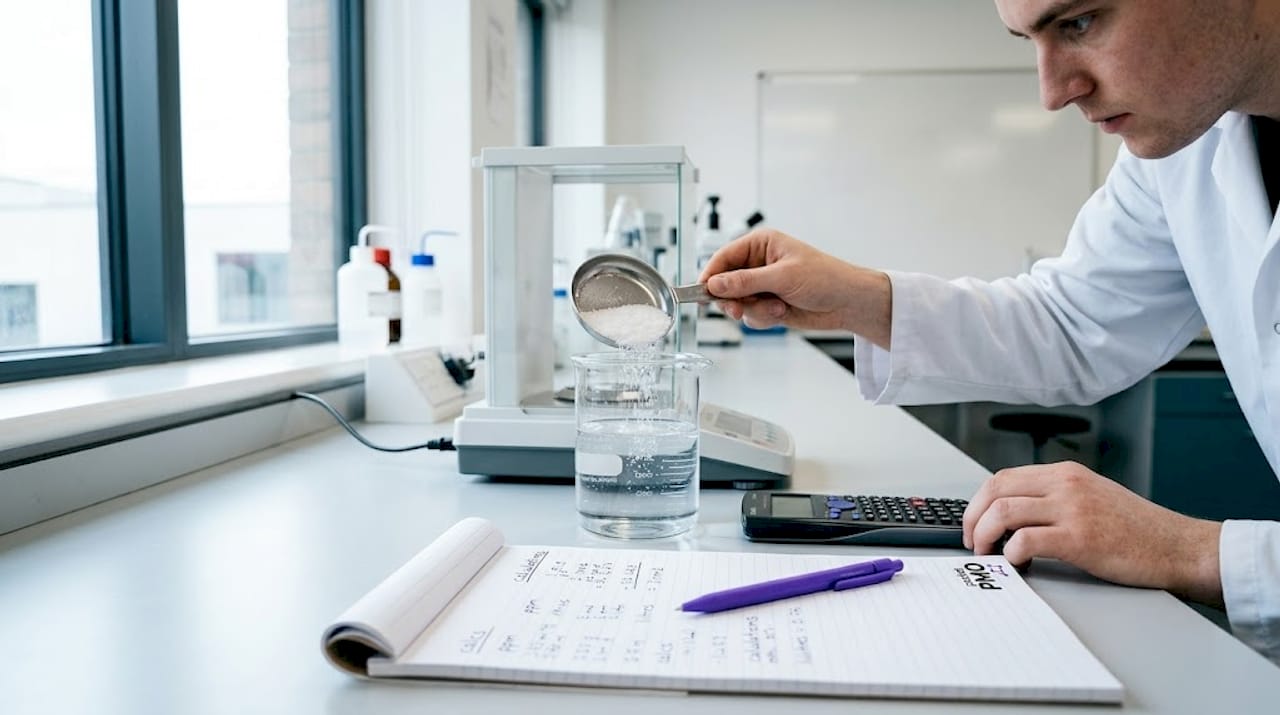
To put that in concrete terms: if you dissolve 0.2 grams of salt into 1 kilogram of water, you get 200 ppm. The calculation itself is simple. The complications come from assumptions people make without realising it.
Ppm in water
For aqueous solutions, there is a widely used shortcut. Because water has a density of approximately 1 gram per millilitre, 1 ppm is treated as equivalent to 1 mg/L. This equivalence holds reliably for dilute solutions. It becomes unreliable when the solution contains significant quantities of dissolved solids, or when the substance being measured is not in water but in a denser carrier.
Ppm in gases
Measuring ppm in gases requires a different approach entirely. Rather than mass ratios, gas ppm uses mole fractions, which express how many molecules of one substance exist per million molecules of the total gas mixture. A reading of 400 ppm CO₂ in the atmosphere means 400 molecules of carbon dioxide per million molecules of air.
Conversion relationships
Understanding how ppm relates to other units prevents errors when interpreting regulatory documentation:
| Unit | Equivalent in ppm | Common use |
|---|---|---|
| 1% | 10,000 ppm | Chemical concentrations |
| 1 ppm | 1,000 ppb | Trace contaminants |
| 1 ppm | 1,000,000 ppt | Ultra-trace detection |
| 1 ppm (water) | ≈ 1 mg/L | Water quality reporting |
The ppm vs mg/l equivalence is the one most professionals rely on in water and wastewater projects. Just do not assume it transfers to every liquid medium.
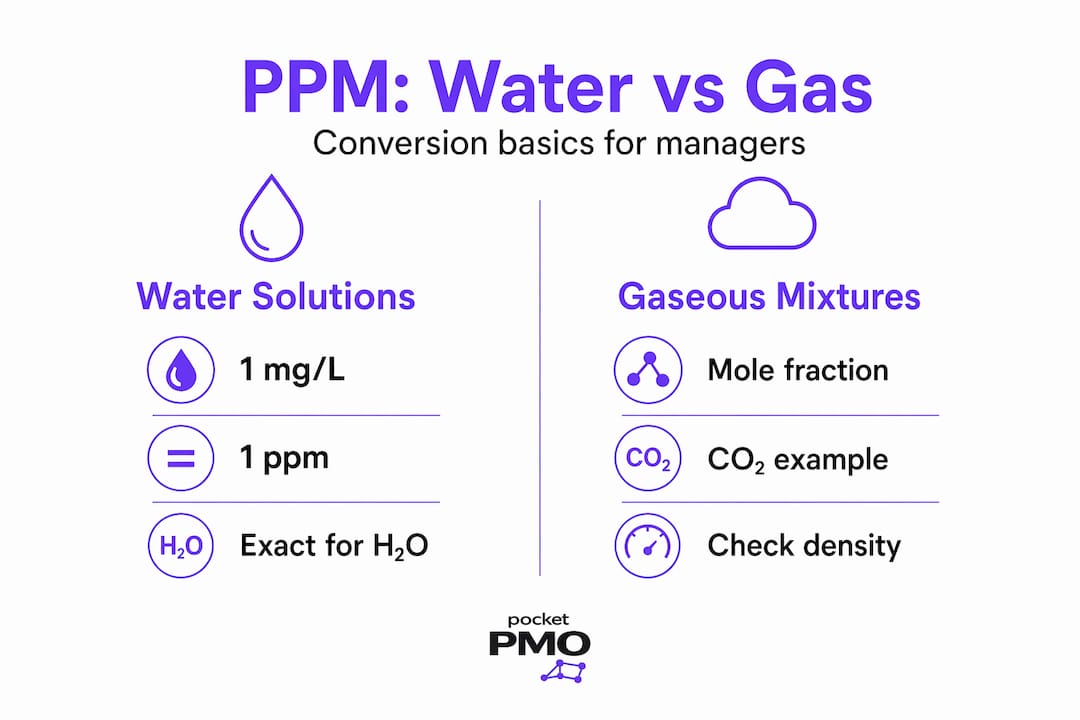
Pro Tip: When converting between ppm and mg/L in project documentation, always state the assumed density of the solution. In regulatory submissions, an unstated assumption can invalidate your data.
Why ppm matters in environmental and industrial projects
The importance of ppm becomes clear the moment you look at what it represents in practice. Small numbers carry large consequences.
Atmospheric CO₂ reached approximately 431 ppm as of May 2026, driven in part by the rapid growth of energy-hungry data centres. That figure is not merely a scientific data point. It informs carbon budgets, scope emissions reporting, and the credibility of net-zero commitments across your portfolio. If your projects touch any aspect of energy use, construction, or facilities management, that number directly affects your risk register.
At lower concentrations, the stakes become sharper rather than smaller. Consider the following substance-specific examples:
- 1 ppm of chlorine gas causes airway irritation and is a recognised occupational health threshold, while 1 ppm of CO₂ is entirely harmless to human health
- Indoor CO₂ above 800 ppm causes measurable tiredness; above 1,200 ppm it reduces cognitive focus; above 2,000 ppm it produces headaches and impaired performance in workers
- Nitrogen dioxide at concentrations as low as 0.5 ppm can aggravate respiratory conditions over sustained exposure
- Chlorine residuals in drinking water are regulated to fall between 0.2 and 4 ppm depending on the jurisdiction
These thresholds are not just health data. They are project triggers. When a monitored value crosses a threshold, it typically requires a change request, a stakeholder notification, or an adjustment to site operations. Professionals who understand this connection can build ppm monitoring directly into their risk management frameworks.
"PPM's importance depends entirely on the chemical and physical properties of the substance being measured. A project manager who treats all ppm readings as equivalent is working without critical context."
Integrating ppm data into project risk registers is not a scientific exercise. It is a governance one. When your team can see that a specific site reading is approaching a regulatory threshold, they can act before a compliance breach becomes a reportable incident.
Pro Tip: When briefing non-technical stakeholders on ppm readings, anchor the number to a tangible consequence. "CO₂ is at 950 ppm in this workspace" lands far less clearly than "CO₂ levels are high enough to reduce team concentration by a measurable amount."
The nuances that trip up experienced teams
Even professionals who are comfortable with ppm measurement often run into problems when the conditions change from the assumptions embedded in their formulas.
-
Temperature and pressure affect gas readings. A ppm reading taken at 15°C and sea level pressure will not equal the same physical concentration if the temperature rises to 35°C. Applying the ideal gas law corrects for this, but many field instruments report raw ppm without normalisation. If your project documentation is pulling from multiple monitoring sources, discrepancies caused by uncorrected temperature and pressure will create apparent contradictions in your data.
-
Liquid density assumptions break under industrial conditions. The 1 ppm equals 1 mg/L shortcut applies to dilute aqueous solutions. In industrial processes involving concentrated brines, acids, or high-solids slurries, the density of the solution differs significantly from water. Using the shortcut in these contexts introduces systematic errors that compound over a reporting period.
-
Molecular weight changes what ppm means in practice. A substance with a high molecular weight occupies a very different mass at the same ppm reading compared to a lighter substance. Two gas streams both measured at 50 ppm can carry drastically different masses of pollutant per cubic metre, which affects both health risk assessments and emissions calculations.
-
Comparing ppm values across datasets without checking methodology is a common source of error. Regulatory databases, contractor reports, and in-house monitoring systems may each use slightly different reference conditions or calculation methods. Reconciling these requires you to check the methodology, not just the number.
Pro Tip: Build a brief ppm methodology note into your standard project documentation templates. It should record the medium, the calculation basis, the assumed density for liquids, and the temperature and pressure conditions for gases. This takes two minutes and prevents significant data disputes downstream.
Applying ppm knowledge in project portfolio management
Understanding ppm theoretically is useful. Building that understanding into your day-to-day project processes is where it creates real value.
Here is a practical comparison of approaches to ppm data management in project environments:
| Approach | Traditional tools | AI-powered platforms |
|---|---|---|
| Data tracking | Manual log entry or spreadsheets | Automated data feeds from monitoring systems |
| Threshold alerts | Requires manual review | Predictive alerts before thresholds are breached |
| Reporting | Static reports produced on schedule | Real-time status updates available on demand |
| Stakeholder communication | Written summaries drafted manually | Auto-generated narrative reports with contextual data |
| Risk integration | Separated from risk register | Directly linked to risk triggers and mitigations |
The practical steps for integrating ppm data into your portfolio management work are straightforward:
- Define which ppm thresholds are operationally or legally significant for each project, and document those thresholds in the risk register from day one
- Connect monitoring data sources to your project status reporting process so that threshold breaches appear immediately in the project dashboard
- Create a standard escalation protocol that specifies who receives notification when a ppm value approaches or exceeds a defined limit
- Use customisable reporting templates that include ppm fields alongside traditional KPIs, so environmental data is never siloed from project performance data
- Accurate ppm tracking directly supports regulatory compliance and gives you concrete, quantifiable evidence for sustainability reporting at portfolio level
The biggest operational shift is treating ppm data as a project input rather than a technical annex. When it sits in your dashboard alongside budget and schedule, it gets managed with the same rigour.
My perspective: ppm is a governance tool, not just a metric
I have spent years working alongside project managers in sectors ranging from infrastructure to facilities and environmental remediation. One pattern appears consistently: teams with strong technical discipline around ppm rarely face compliance surprises. Teams that treat it as a background measurement almost always do.
What I have found is that the problem is almost never the data itself. The sensors are working, the readings are being logged, and the compliance team is aware of the thresholds. The failure happens in translation. When ppm data lives in a separate monitoring system and never appears on the project dashboard, project managers are effectively flying without instruments. They learn about threshold breaches after the fact, which means the mitigation response is reactive, costly, and sometimes reportable.
The professionals who handle this best build ppm checkpoints directly into their change control and risk review processes. If a site CO₂ reading exceeds 1,000 ppm consistently, that is a facilities risk that may require a change request. If chlorine residuals in a water treatment project drop below 0.2 ppm, that is a compliance event, not a technical footnote.
My honest assessment: ppm replaced inconsistent units in the mid-20th century precisely because it gave regulators and engineers a shared language. Project managers who learn to speak that language stop being surprised by environmental and compliance outcomes, and start anticipating them.
— Danny
How Pocketpmo supports precise ppm data in your projects
If you are managing projects with environmental, safety, or sustainability dimensions, the gap between having ppm data and acting on it is largely a reporting and visibility problem. Pocketpmo was built to close that gap.
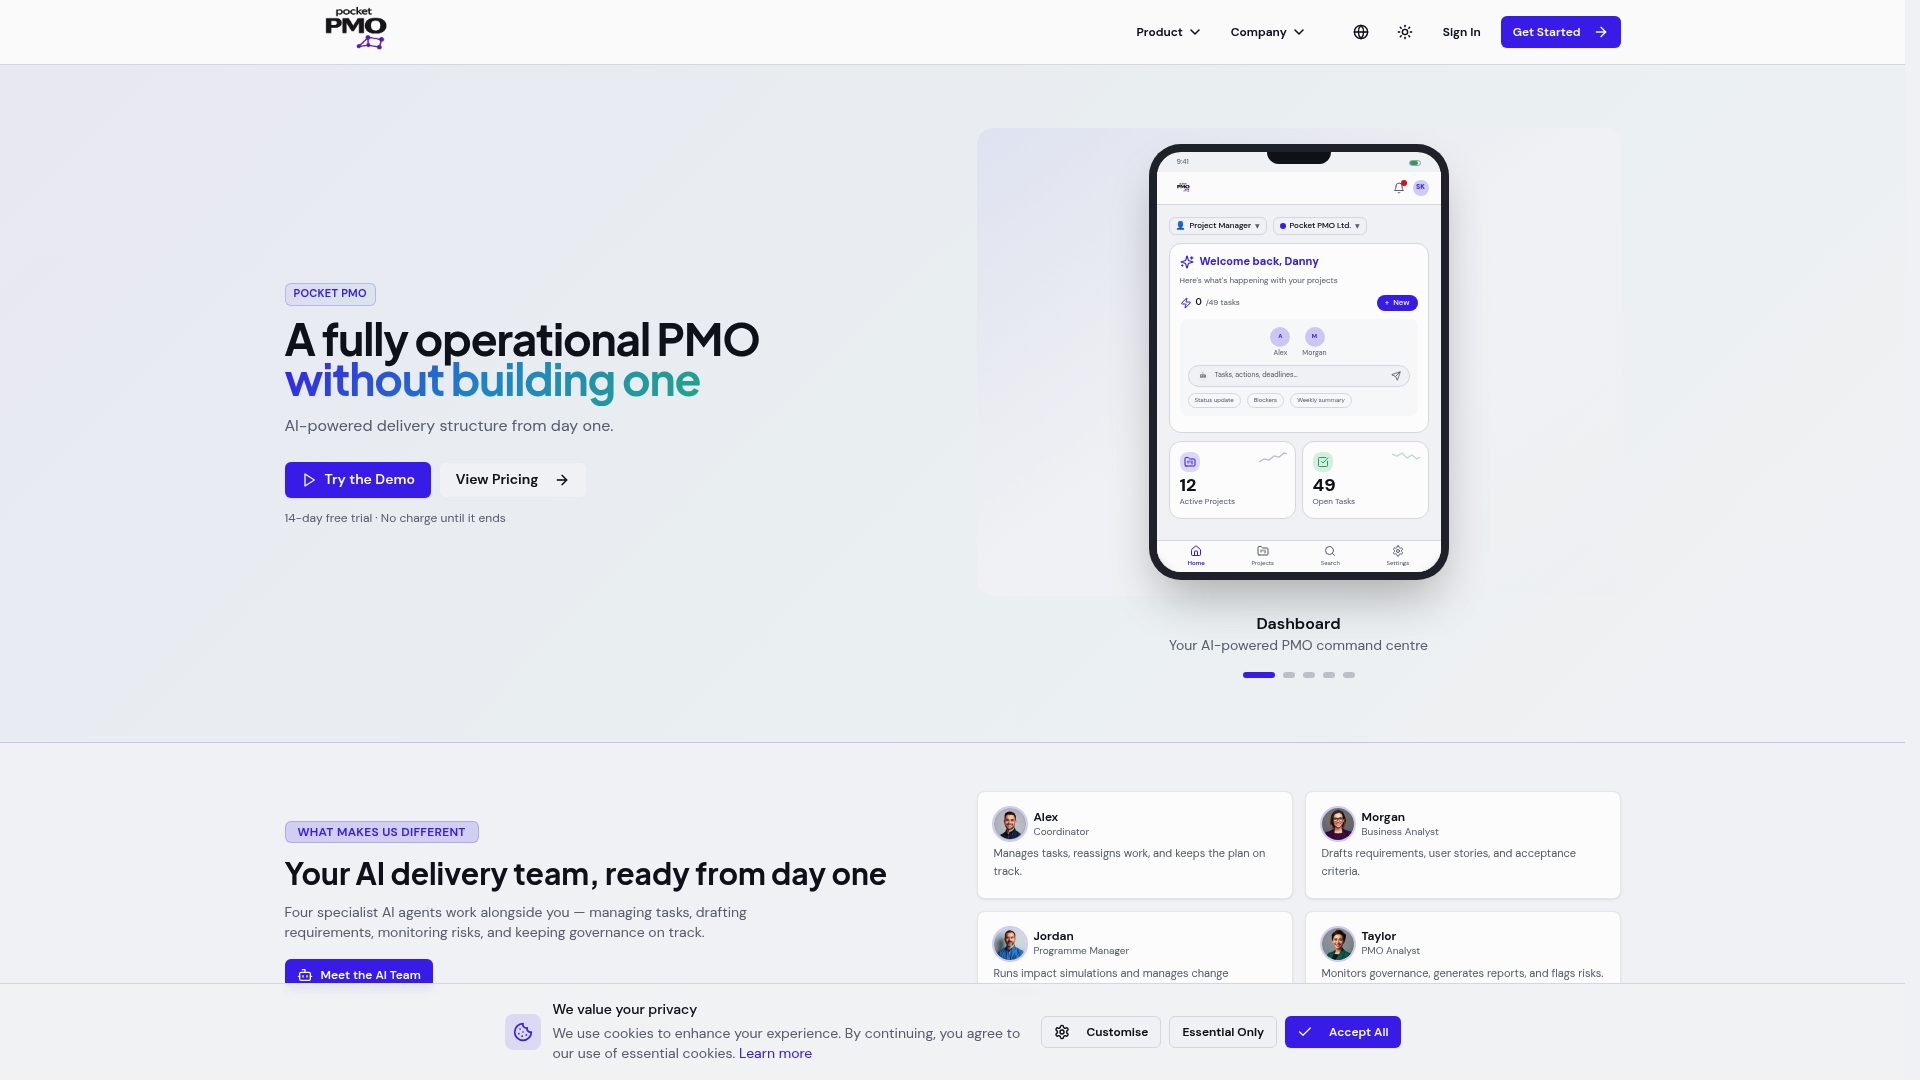
The platform brings together real-time dashboards, AI-driven risk analysis, and automated status reporting in a single environment. You can embed ppm thresholds directly into risk registers, connect monitoring data to project dashboards, and receive predictive alerts before a compliance breach occurs. You do not need to build a PMO from scratch to get that capability.
If you are weighing your options, the Pocket PMO vs Monday.com comparison and the Pocket PMO vs Microsoft Project page both break down where AI-powered governance delivers measurable advantages for projects with complex data requirements. Or explore the full platform at Pocketpmo and see what an operational PMO looks like from day one.
FAQ
What does ppm stand for in science?
PPM stands for parts per million. It expresses the concentration of one substance within a million units of a total mixture, and it is used across environmental science, water quality testing, and industrial safety monitoring.
How do you calculate ppm in water?
Divide the mass of the solute by the mass of the solution, then multiply by 1,000,000. For dilute aqueous solutions, 1 ppm is approximately equal to 1 mg/L because water's density is close to 1,000,000 mg per litre.
What is the difference between ppm and mg/L?
For dilute water-based solutions, ppm and mg/L are numerically equivalent. This equivalence breaks down when the solution has a density significantly different from water, making mass-based ppm the more accurate measure in those cases.
Why does ppm matter for project managers?
PPM thresholds in air, water, and industrial materials often trigger regulatory obligations, operational changes, or risk escalations. Tracking ppm as part of project reporting helps teams anticipate compliance issues rather than respond to them after the fact.
How does indoor CO₂ ppm affect project teams?
Indoor CO₂ levels above 800 ppm cause measurable tiredness, and above 1,200 ppm they reduce cognitive performance. For project managers responsible for workspace environments, monitoring CO₂ is a direct input into team productivity and wellbeing decisions.