

Project delivery metrics are quantifiable indicators that show how well a project meets its objectives across time, budget, scope, quality, and stakeholder engagement. The industry standard term for these measures is Key Performance Indicators, or KPIs, though project managers also refer to them as delivery performance measures or project performance indicators. The five core delivery KPIs consistently tracked across project types are the Schedule Performance Index, Cost Performance Index, Scope Completion Rate, Resource Utilisation Rate, and Stakeholder Satisfaction Score. Together, they give you a complete picture of project health before problems become crises.
1. What are the most critical examples of project delivery metrics?
The most widely used delivery performance measures come from the Earned Value Management framework, which is codified in the PMBOK Guide published by the Project Management Institute. These metrics translate raw project data into ratios and scores that tell you whether you are on track, at risk, or already in trouble.
Schedule Performance Index (SPI)
SPI measures how efficiently your project uses time. An SPI below 0.95 early in a project predicts a high risk of missing the final deadline. That threshold matters because a small schedule slip in week three compounds into a significant overrun by week twelve.
- SPI = 1.0: on schedule
- SPI 0.95–1.0: minor slippage, monitor closely
- SPI below 0.95: escalate and replan
Cost Performance Index (CPI)
CPI measures cost efficiency per unit of work completed. A CPI below 0.90 signals more than 11% cost overspend per unit of work delivered. That figure rarely self-corrects without active intervention.
- CPI = 1.0: on budget
- CPI 0.90–1.0: overspend emerging, review scope
- CPI below 0.90: immediate corrective action required
Scope Completion Rate
Scope Completion Rate tracks the percentage of agreed deliverables completed against the total planned. It is the clearest measure of whether your team is delivering what the client actually signed off on.

Quality metrics: Defect Rate and Rework Rate
Defect Rate counts the number of defects per deliverable. Rework Rate measures the proportion of completed work that must be redone. Both metrics directly affect timelines and team morale. A rework rate above 20% in any workstream indicates poorly defined acceptance criteria and justifies an immediate review of requirements documentation.
Stakeholder Satisfaction Score
This metric captures how well delivery meets stakeholder expectations. Post-implementation, adoption below 60% at 90 days signals that the delivered solution is not being used as intended. An 80% adoption rate at 12 months confirms genuine delivery success.
Resource Utilisation Rate
Resource Utilisation Rate measures the proportion of available capacity actively used on project work. Rates close to 100% are risk signals, not efficiency badges. Constant 100% utilisation removes the slack teams need to solve problems, transfer knowledge, and absorb unexpected work.
Pro Tip: Never track SPI or CPI in isolation. Combine them as an early warning system. A project with SPI of 0.96 and CPI of 0.91 is in a very different position from one where only one index is low.
2. How agile and iterative projects use delivery metrics effectively
Agile projects do not discard the principles behind SPI and CPI. They adapt them to shorter cycles. Sprint velocity, burndown charts, cycle time, and cumulative flow diagrams are the agile equivalents of traditional delivery performance measures.
- Sprint velocity: the average number of story points completed per sprint. Use it for release planning, not as a productivity target.
- Burndown chart: shows remaining work against time within a sprint. A flat or rising burndown line signals blocked work or scope creep.
- Cycle time: measures how long a single work item takes from start to done. Shorter cycle times indicate fewer bottlenecks.
- Cumulative flow diagram: tracks work items across pipeline stages over time. Widening bands in any stage reveal where work is accumulating.
The most common misapplication of agile metrics is using velocity as a performance judgement. Velocity is a planning tool. Comparing velocity between teams, or pressuring teams to increase it, distorts the metric and produces inflated estimates rather than faster delivery. You can read more about effective project delivery steps to see how these principles apply in practice.
Pro Tip: Use metrics as conversation starters in sprint retrospectives, not as absolute verdicts. A falling velocity is a prompt to ask what changed, not a reason to assign blame.
3. What delivery metrics matter most in supply chain and product delivery projects?
Supply chain and physical goods projects require a different set of delivery performance measures. The core framework here is Delivery Performance, which combines two distinct perspectives: On Time and In Full.
| Metric | Definition | Best used when |
|---|---|---|
| DP Singular On Time | Was this specific order delivered on the agreed date? | Single, high-value orders where timing is critical |
| DP Volume On Time | What proportion of total order volume arrived on time? | High-frequency, repeat shipments |
| DP Singular In Full | Was this specific order delivered complete? | Custom or bespoke orders where partial delivery fails |
| DP Volume In Full | What proportion of total volume was delivered complete? | Commodity goods where partial delivery is acceptable |
Delivery Performance metrics combine On Time and In Full views to measure comprehensive delivery success. The combination matters because a shipment that arrives on time but 30% short of the ordered quantity is not a successful delivery.
The DR-DP Matrix helps project teams decide which dimension to prioritise. For perishable goods, On Time takes precedence. For construction materials, In Full matters more because a partial delivery can halt an entire site. Defining this priority before the project begins prevents misaligned performance measurement later.
Choosing the right metric type also depends on order frequency. Volume-based measures suit high-frequency, standardised orders. Singular measures suit bespoke, one-off deliveries where each order carries significant individual weight.
4. How to interpret delivery metric trends and act on them
A single data point tells you where you are. A trend tells you where you are going. Trend analysis is the most underused skill in project performance measurement.
Tracking CPI and SPI together over several weeks reveals systemic project health issues that isolated readings miss. A consecutive weekly decline in both indices over three weeks signals a structural problem, not a one-off variance. That pattern requires escalation, not a note in the weekly report.
Key signals to watch for:
- SPI declining for three consecutive weeks: replan the schedule and identify the root cause of slippage
- CPI below 0.90 and falling: conduct a cost review and assess whether scope needs to be reduced
- Resource utilisation above 90% for four or more weeks: deliberate slack is required for agility; sustained overload predicts burnout and quality failures
- Rework rate rising above 20%: return to requirements documentation and revalidate acceptance criteria with stakeholders
- Stakeholder satisfaction dropping between review cycles: schedule an unplanned check-in rather than waiting for the next formal review
The goal of trend analysis is to act before a metric crosses a critical threshold, not after. PMO dashboards that display rolling metric trends make this far easier than reviewing static weekly snapshots.
Pro Tip: Integrate delivery metrics into your regular project status reports. A metric that only appears in a separate analytics tool gets reviewed far less often than one that sits inside the report your sponsor already reads.
Key takeaways
The most effective approach to project delivery measurement combines schedule, cost, scope, quality, and stakeholder metrics reviewed as trends, not isolated snapshots.
| Point | Details |
|---|---|
| Use SPI and CPI together | A downtrend in both indices over three weeks signals systemic risk requiring escalation. |
| Set quality thresholds early | A rework rate above 20% indicates acceptance criteria failures and requires immediate requirements review. |
| Prioritise trend over single readings | Consecutive weekly declines reveal structural problems that one-off data points conceal. |
| Match metrics to project type | Supply chain projects need On Time and In Full measures; agile projects need velocity and cycle time. |
| Treat high utilisation as a risk | Resource rates near 100% remove the slack needed for problem-solving and knowledge transfer. |
Why I think most teams measure the wrong things
After years of working across project environments, the pattern I see most often is not a lack of metrics. Teams track plenty of numbers. The problem is that they track the wrong ones for their context, or they track the right ones and then do nothing with them.
SPI and CPI are genuinely powerful, but I have seen them used as retrospective comfort rather than forward-looking signals. A project manager who reports an SPI of 0.93 without a recovery plan has simply documented a problem, not managed it. The metric only earns its place when it triggers a decision.
The other mistake I see regularly is treating all metrics as equally important across all projects. A software delivery project and a construction project share almost no meaningful delivery performance measures. Applying the same KPI set to both produces numbers that look authoritative but tell you nothing useful. Choosing metrics based on project context is not optional. It is the difference between measurement and noise.
My practical recommendation: pick five metrics maximum for any single project, make sure at least one covers each of time, cost, and quality, and review them as trends every week. Report them honestly, including when they are bad. A team that hides a falling CPI from its sponsor loses the chance to get help early. Transparent reporting builds the trust that keeps clients and sponsors engaged when things get difficult.
— Danny
How Pocketpmo supports project delivery measurement
Tracking five or more delivery metrics across multiple projects manually is where reporting discipline tends to break down. Pocketpmo brings real-time dashboards, AI-driven risk analysis, and automated status reporting into a single platform, so your key performance metrics are always current and visible.
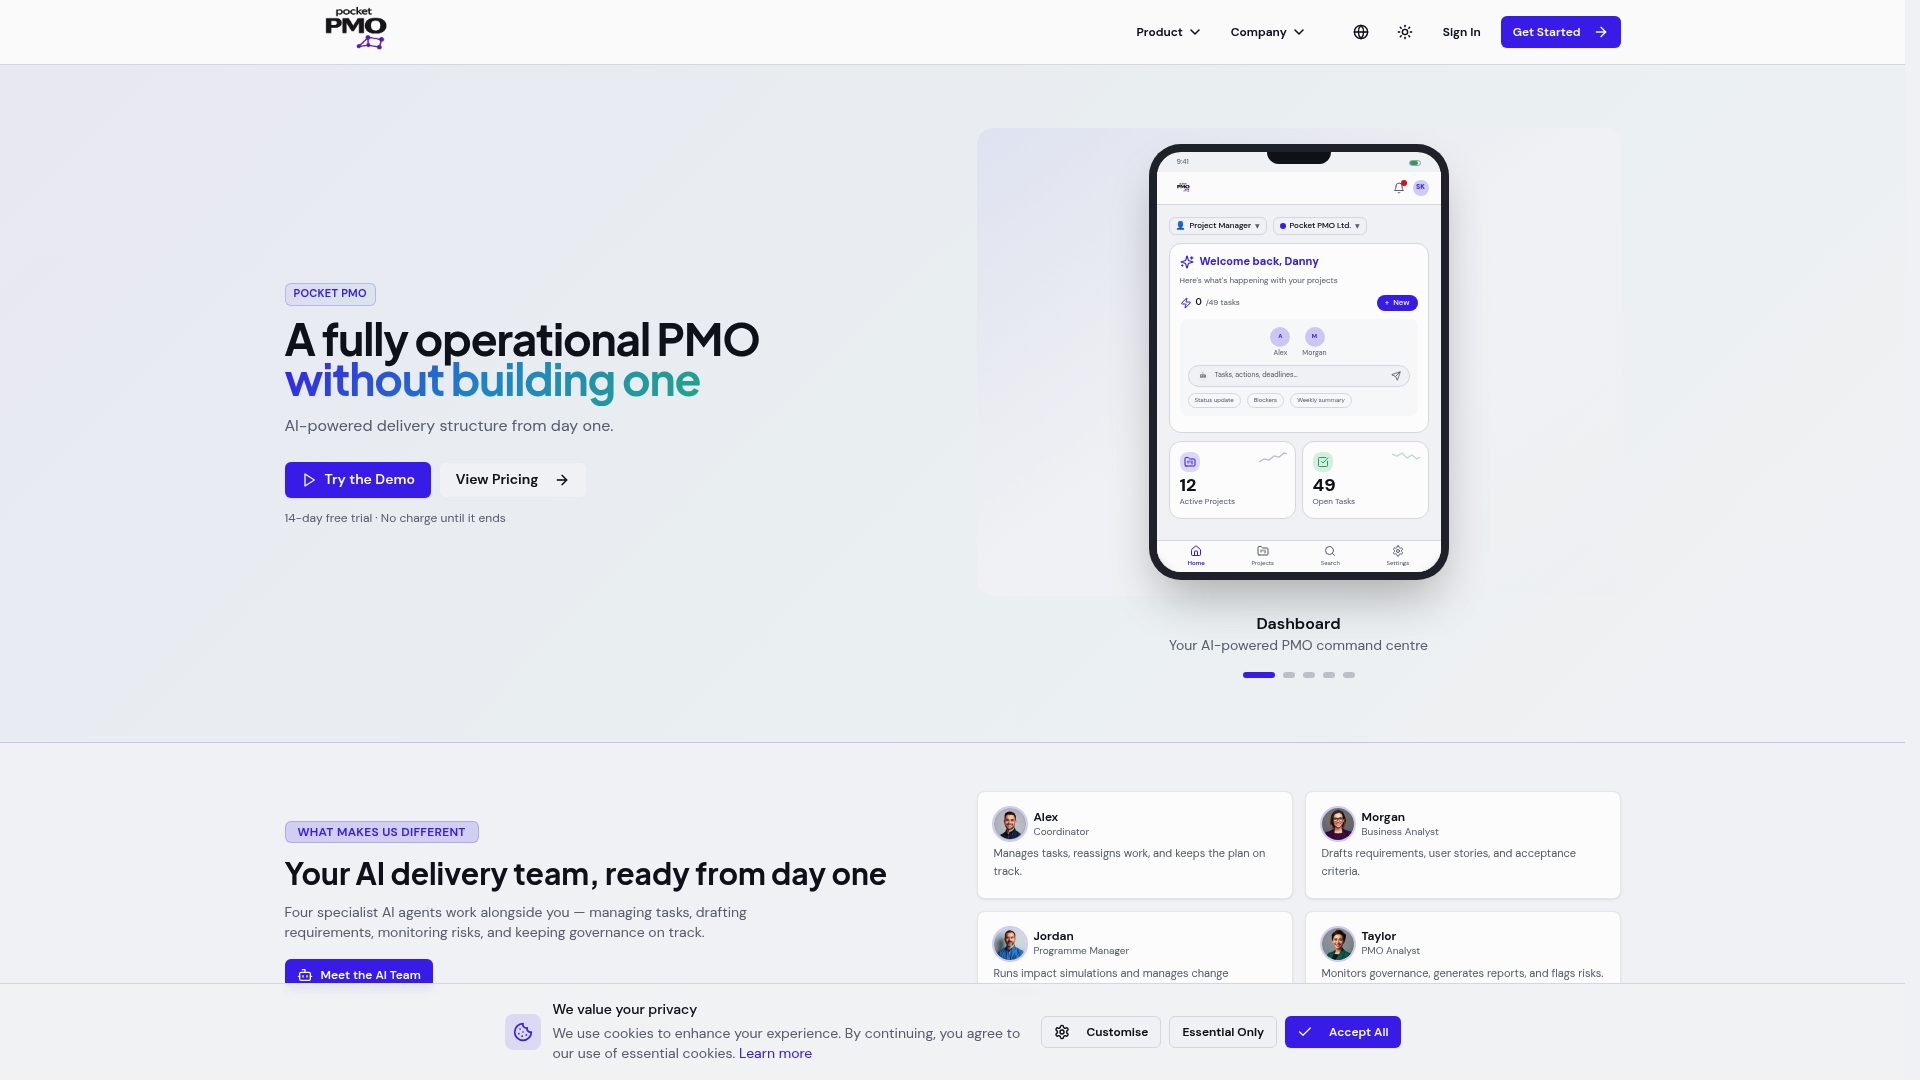
You can customise which delivery performance measures appear on your dashboard, set threshold alerts for SPI, CPI, and resource utilisation, and auto-generate status reports that include trend data rather than point-in-time snapshots. For project managers running complex portfolios, Pocketpmo's AI-powered PMO platform removes the manual effort of collating metrics from separate tools. If you want to see how it handles delivery tracking in practice, the features overview covers the full capability set.
FAQ
What are the most important project delivery metrics?
The five core delivery KPIs are Schedule Performance Index, Cost Performance Index, Scope Completion Rate, Resource Utilisation Rate, and Stakeholder Satisfaction Score. Together they cover time, cost, scope, capacity, and relationship quality.
What does an SPI below 0.95 mean?
An SPI below 0.95 early in a project predicts a high risk of missing the final deadline. It requires immediate schedule review and a documented recovery plan.
How do agile projects measure delivery performance?
Agile projects use sprint velocity, burndown charts, cycle time, and cumulative flow diagrams as their primary delivery performance measures. Velocity is a planning tool, not a productivity score.
What is Delivery Performance in supply chain projects?
Delivery Performance combines On Time and In Full measures to assess whether orders arrive when expected and complete. The right balance between the two depends on whether timing or completeness is more critical for the business.
When should a rework rate trigger a project review?
A rework rate above 20% in any workstream indicates poorly defined acceptance criteria. That threshold justifies an immediate review of requirements documentation and stakeholder sign-off processes.