

Project analytics is the process of analysing real-time and historical project data to make informed, proactive decisions that improve outcomes. Understanding why project managers need analytics is no longer optional. Projects that rely on gut instinct and status meetings alone consistently miss deadlines, overspend, and fail to surface risks until damage is done. Tools like Baserow and platforms such as Pocketpmo, combined with frameworks like PMBOK 8's work performance information, give project managers the structured data layer needed to move from reactive firefighting to confident, evidence-based control.
Why project managers need analytics: the core case
Analytics in project management identifies risks before they escalate, using real-time progress visibility to move decisions beyond guesswork. That single capability alone justifies the investment. Without it, you are managing a project through a rear-view mirror, seeing problems only after they have already cost you time or budget.
The role of analytics in project success extends across every phase of delivery. During planning, data informs realistic baselines. During execution, it tracks variance and flags deviations early. During closure, it feeds retrospective intelligence that improves future estimates. Each phase produces data; analytics converts that data into decisions.

The importance of analytics for project managers also shows up in stakeholder confidence. When you present a dashboard showing cost performance index (CPI) trending at 0.94 with a corrective action already in motion, stakeholders trust the process. When you present a verbal update saying "things are mostly on track," they do not.
What is work performance information and why does it matter?
Work performance information (WPI) is a PMBOK 8 concept that defines analysed data compared against baselines, producing metrics that support reporting and forecasting. It is the critical distinction between raw measurements and meaningful project intelligence.
Raw data tells you that 40 tasks are complete. WPI tells you whether those 40 tasks represent good or poor value for the money spent. The formulas that power WPI include:
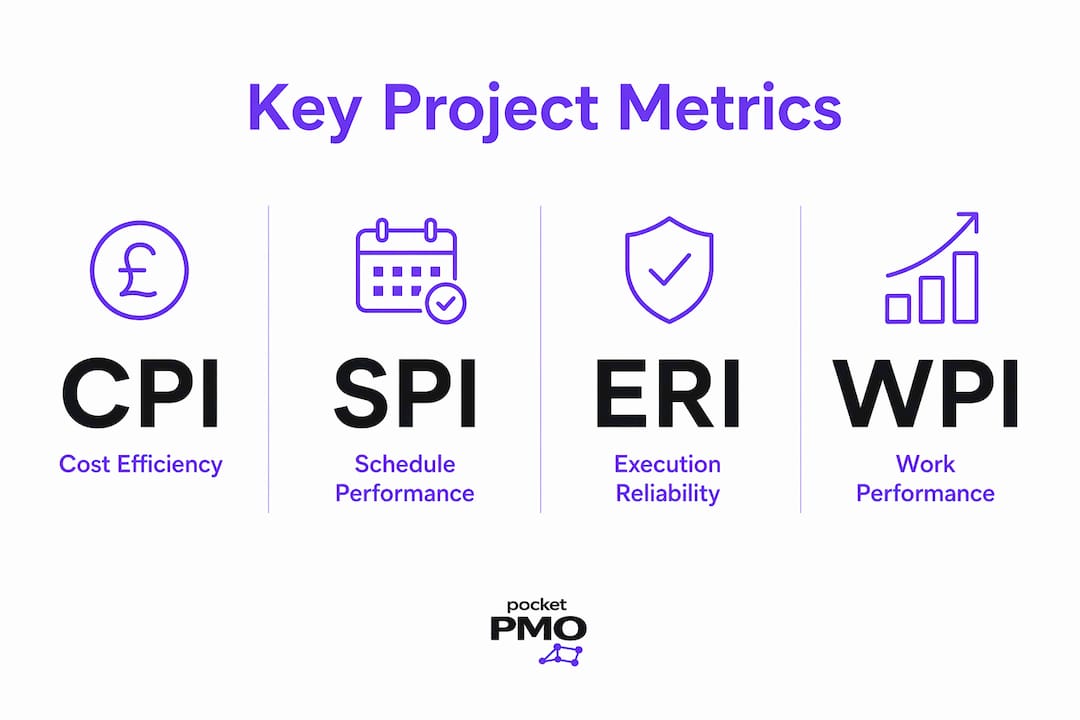
- CPI (Cost Performance Index): CPI = EV/AC. A CPI below 1.0 signals cost overrun.
- SPI (Schedule Performance Index): SPI = EV/PV. An SPI below 1.0 signals schedule delay.
- CV (Cost Variance): CV = EV minus AC. Negative CV means you are over budget.
- SV (Schedule Variance): SV = EV minus PV. Negative SV means you are behind schedule.
- EAC (Estimate at Completion): Projects the final cost based on current performance.
- ETC (Estimate to Complete): Calculates remaining cost to finish the project.
| Metric | Formula | What it signals |
|---|---|---|
| CPI | EV / AC | Cost efficiency of work performed |
| SPI | EV / PV | Schedule efficiency of work performed |
| EAC | BAC / CPI | Projected total cost at completion |
| ETC | EAC minus AC | Remaining budget required to finish |
Many dashboards fail by mixing raw data with WPI, which distorts reporting and undermines stakeholder trust. PMBOK 8 separates these layers deliberately. Standardising your analytics layer so that dashboards display only WPI-level outputs, not raw task counts, improves both the frequency and quality of performance assessment. Automated dashboards that calculate these formulas in real time remove the manual effort and reduce the risk of human error in reporting.
How do analytics improve risk management and schedule reliability?
Traditional risk registers are administrative tools. They catalogue known risks but rarely predict when those risks are about to materialise. The benefits of data analysis in projects become most visible when analytics moves beyond the register and into live monitoring.
Leading indicators like the Execution Reliability Index (ERI) improve risk and schedule oversight far more effectively than optimistic percent-complete reporting. In a construction case study, a decline in ERI triggered corrective actions that preserved both the completion date and the project contingency. That outcome is impossible when your only schedule signal is a Gantt chart showing 68% complete.
ERI measures whether planned activities on the critical path are actually completing as scheduled, not just whether work is happening somewhere on the project. This distinction matters enormously. A project can show 70% overall completion while the critical path is running three weeks late, and a percent-complete dashboard will not show you that until it is too late to recover.
True risk reduction requires modelling production system variability and its drivers, rather than relying on administrative risk registers. Factors like work-in-progress (WIP), cycle time, and throughput variability are the real drivers of schedule risk. Modelling these gives you realistic contingency estimates, not optimistic ones. For practical guidance on applying these methods, the risk management tips for project managers resource covers leading indicator frameworks in detail.
Pro Tip: Align your leading indicators directly with critical path activities. A general project health score is far less useful than an ERI calculated specifically for the tasks that determine your end date.
Which key metrics should project managers prioritise?
Data overload is a genuine risk in analytics adoption. The role of analytics in PMO environments is not to report everything. It is to surface the few signals that drive decisions.
PMOs succeed by focusing on a small set of North Star KPIs plus scored risk factors for decision-relevant monitoring. Selecting too many metrics creates noise that buries the signals you actually need. The right approach is to identify the metrics that directly reflect whether the project will deliver its intended benefits, then build your dashboard around those alone.
A practical set of North Star KPIs for most projects includes:
- Progress to goals: Are deliverables completing at the rate required to meet the deadline?
- Project health score: A composite of CPI, SPI, and risk status that gives a single-number view of overall performance.
- Top risks by scored severity: Risks ranked by probability multiplied by impact, updated weekly.
- Resource capacity vs. demand: Are the right people available at the right time to sustain the current plan?
- Change request volume and approval rate: A rising volume of unapproved changes is an early warning of scope instability.
PMOs' data-driven decisions are operating model choices that prioritise the right data over comprehensive data. This is a governance decision as much as a technical one. When your PMO agrees on five metrics that matter, every project manager reports against the same framework, and portfolio-level comparisons become meaningful rather than misleading.
What tools and techniques help implement analytics effectively?
Knowing which metrics to track is only half the answer. The other half is building the infrastructure to track them without creating a second full-time job.
Platforms like Baserow and ClickUp integrate project management and analytics in a single environment, allowing you to build dashboards that pull live data from task completion, time logs, and budget entries. The key capability to look for is automated dashboards and predictive models that reduce manual effort and support proactive decision-making. When your CPI calculates automatically every time an actuals entry is logged, you get real-time performance visibility without a weekly spreadsheet exercise.
Automation also protects data quality. Workflow triggers that enforce mandatory fields before a task can be marked complete prevent the incomplete data that corrupts performance metrics. A dashboard built on clean, consistently structured data produces reliable signals. One built on ad hoc entries produces noise.
- Standardise your data model first. Define what "complete" means for every task type before building any dashboard.
- Separate raw data from WPI outputs. Your dashboard should display calculated metrics, not raw counts.
- Set automated alerts for threshold breaches. A CPI dropping below 0.9 should trigger a notification, not a weekly review meeting.
- Review dashboard design quarterly. Metrics that were relevant in month one may not reflect the current project phase.
Pro Tip: Before selecting a tool, map the analytics outputs you need first. Then evaluate platforms on whether they can produce those outputs automatically. Choosing a tool and then trying to extract the metrics you need is the wrong sequence.
Dashboards should prioritise leading signals that predict whether commitments will hold, not just lagging measures that confirm what already happened. The practical implication: every dashboard should contain at least one forward-looking metric alongside its historical performance data.
How do analytics shift project management from opinion to evidence?
The most significant benefit of data analysis in projects is not operational. It is cultural. Evidence-based project management replaces intuition with bias-conscious, data-driven decisions, and AI is accelerating that shift.
"AI supports retrospective intelligence, forward-looking decision support, early risk warning, and structured issue management." — PM World Journal
When decisions are grounded in WPI and scored risk data, the conversation in a project review changes. Instead of debating whether the project "feels" on track, the team discusses what the CPI trend implies for the EAC and what corrective action is needed this week. That is a fundamentally more productive conversation, and it builds stakeholder trust far faster than confident verbal updates.
AI augmentation creates a modern competency in project management that combines technology with professional expertise and organisational culture. This is not about replacing the project manager's judgement. It is about giving that judgement a factual foundation. Platforms that integrate AI in project management are already delivering early risk warnings and automated issue escalation that would previously have required a dedicated analyst. The project managers who adopt these capabilities earliest will carry a measurable advantage in delivery reliability and stakeholder confidence.
Key takeaways
Analytics transforms project management from reactive reporting to proactive control by converting raw data into work performance information, leading indicators, and evidence-based decisions.
| Point | Details |
|---|---|
| WPI over raw data | Calculate CPI, SPI, EAC, and ETC automatically to produce meaningful performance signals. |
| Leading indicators matter | Use ERI and critical path metrics rather than percent complete to catch schedule risk early. |
| Fewer, better KPIs | Select five North Star metrics aligned to project benefits rather than tracking everything. |
| Automate data quality | Workflow triggers and automated dashboards remove manual effort and protect metric reliability. |
| Evidence beats opinion | Structured analytics and AI augmentation replace intuition with decisions grounded in data. |
Analytics maturity is a governance decision, not a technology upgrade
I have worked with project managers who had access to excellent analytics tools and still ran their projects on instinct. The tools were there. The dashboards were built. But the weekly review still opened with "how does everyone feel about where we are?" That question is the symptom of an analytics culture problem, not a technology gap.
The most common pitfall I see is mixing raw task data with performance information on the same dashboard. A project manager sees 47 tasks complete and interprets that as progress. But without knowing the earned value of those tasks relative to the planned value and actual cost, that number tells you almost nothing. PMBOK 8 separates these layers for a reason, and your dashboards should too.
The second pitfall is choosing percent complete as your primary schedule signal. It is optimistic by nature. Teams report tasks as 90% complete for weeks. ERI, tied to critical path activity completion, removes that ambiguity. Either the activity finished on the planned date or it did not. That binary clarity is what makes it a genuinely useful leading indicator.
Analytics maturity in a PMO is ultimately a governance shift. It requires agreement on which metrics matter, a commitment to data quality, and the discipline to make decisions based on what the numbers show rather than what the team hopes is true. The technology supports that shift. It does not create it.
— Danny
How Pocketpmo puts analytics to work for you
Pocketpmo delivers a fully operational PMO platform with integrated analytics built in from day one. You get real-time dashboards, automated WPI calculations, AI-driven risk analysis, and portfolio-level reporting without building the infrastructure yourself.
Whether you are comparing options or ready to move, see how Pocketpmo stacks up against Monday.com on analytics and usability. The platform is designed for project managers, PMOs, and consultancies who need reliable performance data without the overhead of a dedicated analytics team. Start with a free trial and see your project data converted into decisions from the first week.
FAQ
What is work performance information in project management?
Work performance information (WPI) is analysed project data compared against baselines, producing metrics like CPI, SPI, EAC, and ETC. PMBOK 8 defines it as the layer between raw measurements and stakeholder-ready reports.
How do analytics improve risk management in projects?
Analytics improve risk management by replacing static risk registers with live leading indicators such as the Execution Reliability Index (ERI), which signals schedule risk before it becomes unrecoverable.
Which metrics should a project manager track first?
Start with CPI, SPI, and a scored risk register. These three outputs cover cost performance, schedule performance, and risk severity in a format that directly informs corrective decisions.
What is the difference between leading and lagging indicators?
Lagging indicators confirm what has already happened, such as cost variance at month end. Leading indicators predict whether future commitments will hold, such as ERI tracking critical path completion rates.
How does AI support analytics in project management?
AI augments project analytics by automating retrospective analysis, generating early risk warnings, and providing forward-looking decision support that would otherwise require dedicated analyst resource.