

Predictive analytics in project management is defined as the use of historical project data, statistical models, and machine learning algorithms to forecast risks, resource needs, and schedule outcomes before they occur. Organisations deploying predictive resource engines see a 21% revenue increase and a 35% reduction in administrative hours in the first year. That scale of impact explains why the Project Management Institute now treats data-driven forecasting as a core competency, not an optional add-on. Pocketpmo builds this capability directly into its AI-powered PMO platform, making it accessible to project managers without a data science team behind them.
What is predictive analytics in project management?
Predictive analytics uses patterns in past project performance to generate probability-based forecasts about future outcomes. The inputs include historical timelines, budget actuals, resource logs, risk registers, and external variables such as supplier lead times or market conditions. Tools integrate this data from project schedules, finances, and operational sources to build models that flag risk before it becomes variance.
The most common techniques are regression analysis, Monte Carlo simulation, and classification algorithms. Regression identifies relationships between variables, such as how scope changes correlate with schedule overruns. Monte Carlo simulation runs thousands of scenario iterations to produce a probability distribution for completion dates or costs. Classification models label projects or tasks as high, medium, or low risk based on learned patterns.

Well-calibrated predictive models achieve 65–75% accuracy in detecting at-risk projects two to three months before the problem surfaces. That early warning window is the core value. It gives project managers time to act, not just react.
Pro Tip: Treat predictive analytics as an intelligence layer sitting on top of your existing controls, not a replacement for Critical Path Method or Earned Value Management. The two approaches work best together.
What data and tools do you need to get started?
The quality of your predictions depends entirely on the quality of your historical data. Data hygiene is the biggest predictor of success. Clean, standardised project records covering timelines, budgets, change logs, and resource utilisation are non-negotiable inputs.
| Data type | Use in predictive models |
|---|---|
| Historical timelines | Train schedule risk and delay forecasting models |
| Budget actuals vs. plan | Identify cost overrun patterns and variance triggers |
| Resource utilisation logs | Forecast bottlenecks and capacity shortfalls |
| Risk registers | Classify risk likelihood and impact from past events |
| External variables | Adjust forecasts for supplier, market, or seasonal factors |
Before selecting any platform, audit your existing data. Ask three questions: Is it complete? Is it consistent across projects? Is it stored in a format a model can read? If the answer to any of these is no, data cleansing must come before model training.
The most capable platforms for advanced project analytics combine real-time dashboards with AI-driven risk scoring. Entry-level field apps handle basic reporting. Enterprise platforms with built-in machine learning, such as Pocketpmo, go further by embedding probabilistic forecasts directly into portfolio views and risk workflows.
Pro Tip: Start with two or three years of completed project data from similar project types. Mixing infrastructure projects with software delivery projects in one model produces noisy, unreliable outputs.
How do you implement predictive analytics step by step?
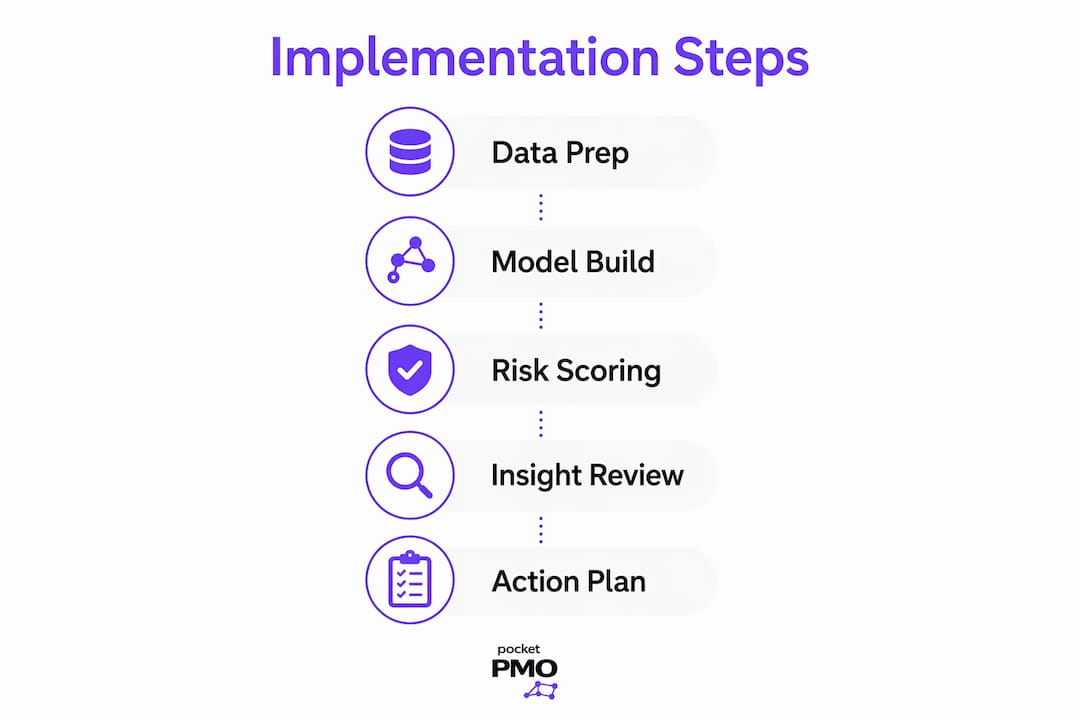
Implementation works best as a phased process. Rushing to full deployment across a portfolio before validating a single model is the most common mistake teams make.
-
Define a narrow forecast target. Choose one high-value question: "Will this project exceed budget by more than 10%?" or "Is the delivery date at risk?" Focused pilot models are easier to validate and build stakeholder confidence faster than broad, multi-variable forecasts.
-
Prepare and cleanse your historical data. Standardise field names, remove duplicates, and fill gaps in resource logs. This step typically takes longer than teams expect. Budget at least two to four weeks for a dataset covering 20 or more past projects.
-
Train and validate the model. Split your historical data into a training set and a holdout validation set. Run the model against the holdout data to measure accuracy before using it on live projects.
-
Embed outputs into decision workflows. Successful organisations embed predictive outputs into weekly portfolio reviews and resource planning meetings. A risk score sitting in a dashboard no one opens adds no value.
-
Manage stakeholder expectations. Predictions are probabilities, not certainties. Brief your sponsors and team leads on what a 70% schedule risk flag means and what it does not mean.
-
Monitor and retrain regularly. Project environments change. A model trained on pre-2023 data may not reflect current supply chain volatility or hybrid working patterns. Schedule quarterly reviews of model accuracy.
| Phase | Key activity | Success measure |
|---|---|---|
| Data preparation | Cleanse and standardise historical records | Zero missing fields in training dataset |
| Pilot model | Train on one forecast type, validate on holdout data | 65%+ accuracy on validation set |
| Workflow integration | Embed risk scores in portfolio reviews | Flags reviewed in weekly governance meetings |
| Continuous improvement | Retrain model quarterly | Accuracy maintained or improved over time |
How do you interpret and act on predictive outputs?
Predictive analytics produces probability estimates, not definitive answers. A model flagging a project at 72% risk of schedule overrun means that, based on historical patterns, seven in ten similar projects at this stage ran late. Human judgement remains central to deciding what to do with that signal.
Project managers must contextualise every alert. A 72% risk flag on a project with a fixed regulatory deadline demands immediate escalation. The same flag on a project with two months of float may warrant monitoring rather than intervention. The model does not know the difference. You do.
Common signals worth acting on include:
- Task duration creep. Tasks consistently taking longer than planned signal scope ambiguity or resource constraints. Early warning flags like this allow intervention before variance compounds.
- Resource contention. When two or more critical path tasks compete for the same resource, the model scores the bottleneck risk. Reassign or reschedule before the clash occurs.
- Budget burn rate deviation. Spending faster than planned in the first third of a project is a strong predictor of final cost overrun.
- Change request volume. A spike in change requests early in delivery correlates with scope instability and schedule risk.
A common misconception is that AI forecasting replaces scheduling disciplines such as CPM or EVM. AI-based forecasting complements traditional project controls, enhancing confidence and early warning capability rather than substituting them.
Pro Tip: When presenting a risk flag to a sponsor, always pair the probability score with a recommended action. "The model shows 70% schedule risk" lands better as "The model shows 70% schedule risk; I recommend we review the resource plan for weeks six and seven."
What are the common challenges and how do you overcome them?
Adoption of advanced project analytics fails most often for predictable reasons. Knowing them in advance lets you plan around them.
- Poor data quality. Incomplete timelines and inconsistent resource logs produce unreliable forecasts. Fix the data before building the model, not after.
- Scope that is too broad. Teams that try to predict everything at once validate nothing. Start with one forecast type and expand only after proving accuracy.
- Lack of explainability. Stakeholders who do not understand why a model flagged a risk will not act on it. Use plain-language summaries alongside probability scores.
- Model drift. A model trained on historical data becomes less accurate as the project environment changes. Schedule retraining as a recurring governance activity.
- Organisational resistance. Project managers who feel their judgement is being replaced will resist adoption. Position the model as a decision support tool, not a decision-maker.
Predictive analytics acts as an intelligence layer providing early warning and probabilistic risk scores. It is not a replacement for core project control frameworks. The project manager remains the decision-maker; the model sharpens the information they act on.
Generative AI is emerging as the next layer, with a growing emphasis on explainability and human-AI collaboration across project lifecycles. That shift makes the case for building strong data foundations now, before the tooling advances further.
Key takeaways
Predictive analytics in project management works because it converts historical performance data into probability-based forecasts that give project managers time to act before risks become problems.
| Point | Details |
|---|---|
| Data quality is the foundation | Clean, standardised historical records determine model accuracy more than any other factor. |
| Start narrow, then expand | Pilot one forecast type before scaling to portfolio-wide prediction. |
| Outputs require human interpretation | Probability scores inform decisions; project managers decide the response. |
| Embed outputs in governance | Risk flags only add value when reviewed in scheduled portfolio and resource meetings. |
| Retrain models regularly | Quarterly reviews maintain accuracy as project environments and team patterns change. |
Why I think most teams get predictive analytics backwards
The teams I see struggle most with predictive analytics share one habit: they buy the platform before they fix the data. They spend months configuring dashboards and training models, then wonder why the outputs feel unreliable. The answer is almost always in the historical records. Incomplete timelines, resource logs with gaps, and change logs that were never maintained consistently. The model is only as good as what you feed it.
The second mistake is treating the first risk flag as a verdict. I have watched project managers dismiss a model's early warning because it contradicted their gut feeling, and I have watched others escalate unnecessarily because they took a probability score as a certainty. Neither response is right. The skill is in reading the signal in context, which is exactly what experienced project managers are trained to do. The model sharpens that skill; it does not replace it.
The teams that get the most value from AI in project management treat it as a phased capability build. They start with one forecast type, validate it rigorously, and then expand. They also invest in explaining the outputs to sponsors in plain language. Executive sponsorship follows understanding. Understanding follows transparency. That sequence matters more than the sophistication of the model.
My honest recommendation: spend the first month on data, not on tooling. The platform you choose matters far less than the quality of the records you bring to it.
— Danny
How Pocketpmo puts predictive analytics to work for you
Pocketpmo integrates predictive analytics directly into its AI-powered PMO platform, giving project managers risk scores, resource forecasts, and schedule alerts without needing a separate data science function.
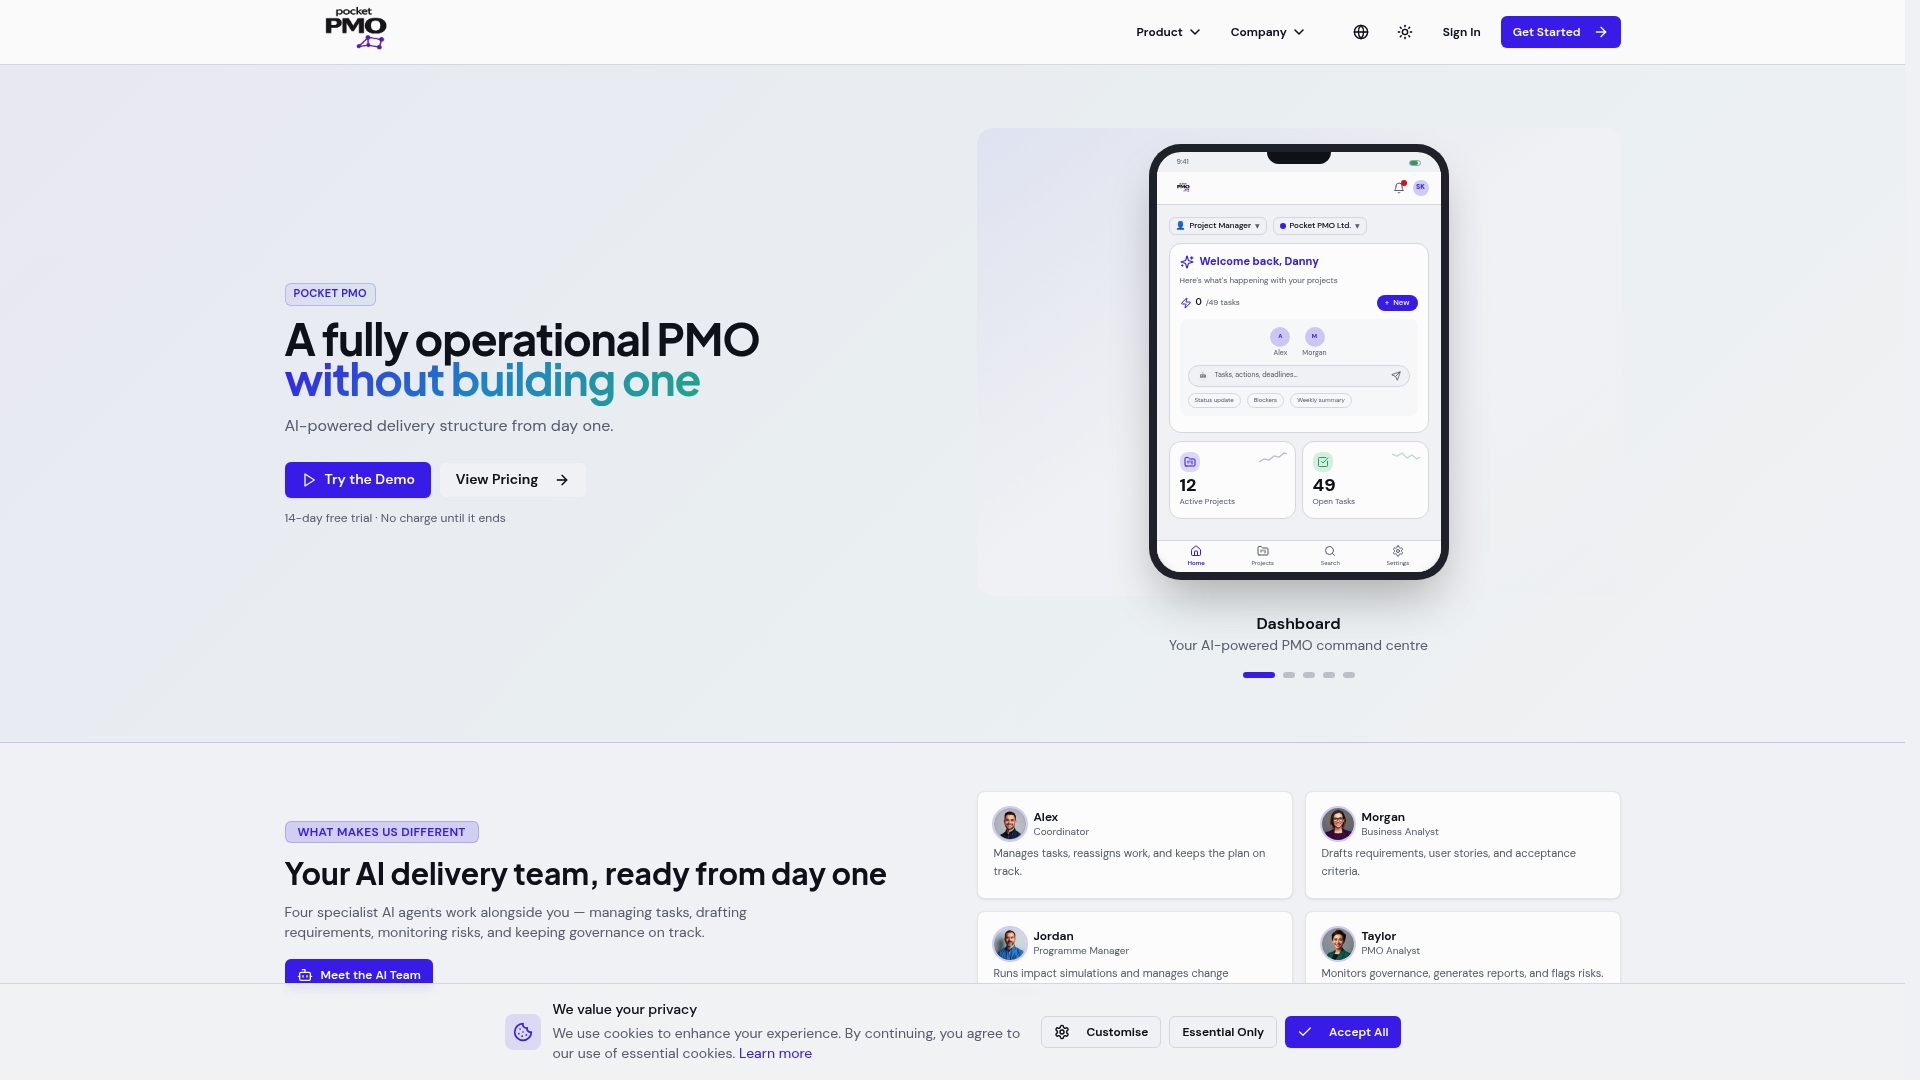
The platform ingests your project schedules, budgets, and risk registers, then surfaces probability-based flags in real-time portfolio dashboards. Change request workflows, RAID management, and automated status reporting all connect to the same data layer, so your predictive outputs stay current as projects evolve. If you want to see how Pocketpmo compares on specific capabilities, the Pocketpmo vs Microsoft Project page gives you a direct, honest breakdown. For project managers who need a fully operational PMO from day one, Pocketpmo is built to deliver exactly that.
FAQ
What is predictive analytics in a PMO?
Predictive analytics in a PMO is the use of historical project data and machine learning models to forecast schedule, cost, and resource risks before they occur. It gives PMO leaders probability-based signals to prioritise governance actions across a portfolio.
How accurate are predictive models in project management?
Well-calibrated predictive models achieve 65–75% accuracy in flagging at-risk projects two to three months before the issue surfaces. Accuracy depends heavily on the quality and completeness of the historical data used for training.
Does predictive analytics replace traditional scheduling methods?
Predictive analytics complements methods such as Critical Path Method and Earned Value Management rather than replacing them. AI forecasting adds early warning capability; traditional controls provide the baseline plan and performance measurement framework.
What data do you need to start using predictive analytics?
The core inputs are historical project timelines, budget actuals, resource utilisation logs, risk registers, and change logs. Clean, standardised records covering at least two to three years of completed projects produce the most reliable models.
What is the biggest risk when implementing predictive analytics?
Poor data quality is the leading cause of failed implementations. Incomplete or inconsistent historical records produce unreliable forecasts, which erodes stakeholder trust and stalls adoption before the model delivers value.